The Analytics Hub helps researchers use BCNTB data and publicly available data to its full potential by providing an environment from which data can be queried, filtered, analysed and integrated into current and future projects.

Data Content

The Analytics Hub hosts research data from BCNTB projects and publicly available datasets.


BCNTB RESEARCH DATA

Genomics England (100,000 Genomes Project) (GEL). A subset of genomic data from patients consented by both the BCNTB and GEL are available for further investigation. These patients presented predominantly with triple negative breast cancer, however an additional cohort of patients encompassing a range of receptor status will be made available in the next release.
Spatial characterisation of tissues surrounding breast cancer (Spatial Project). This project conducted a spatial characterisation of tumour and matched histologically normal tissues resected proximal to (<2 cm) and distal from (5-10 cm) primary tumour. The mRNA expression data from this project is available for analysis.

PUBLICLY AVAILABLE DATASETS

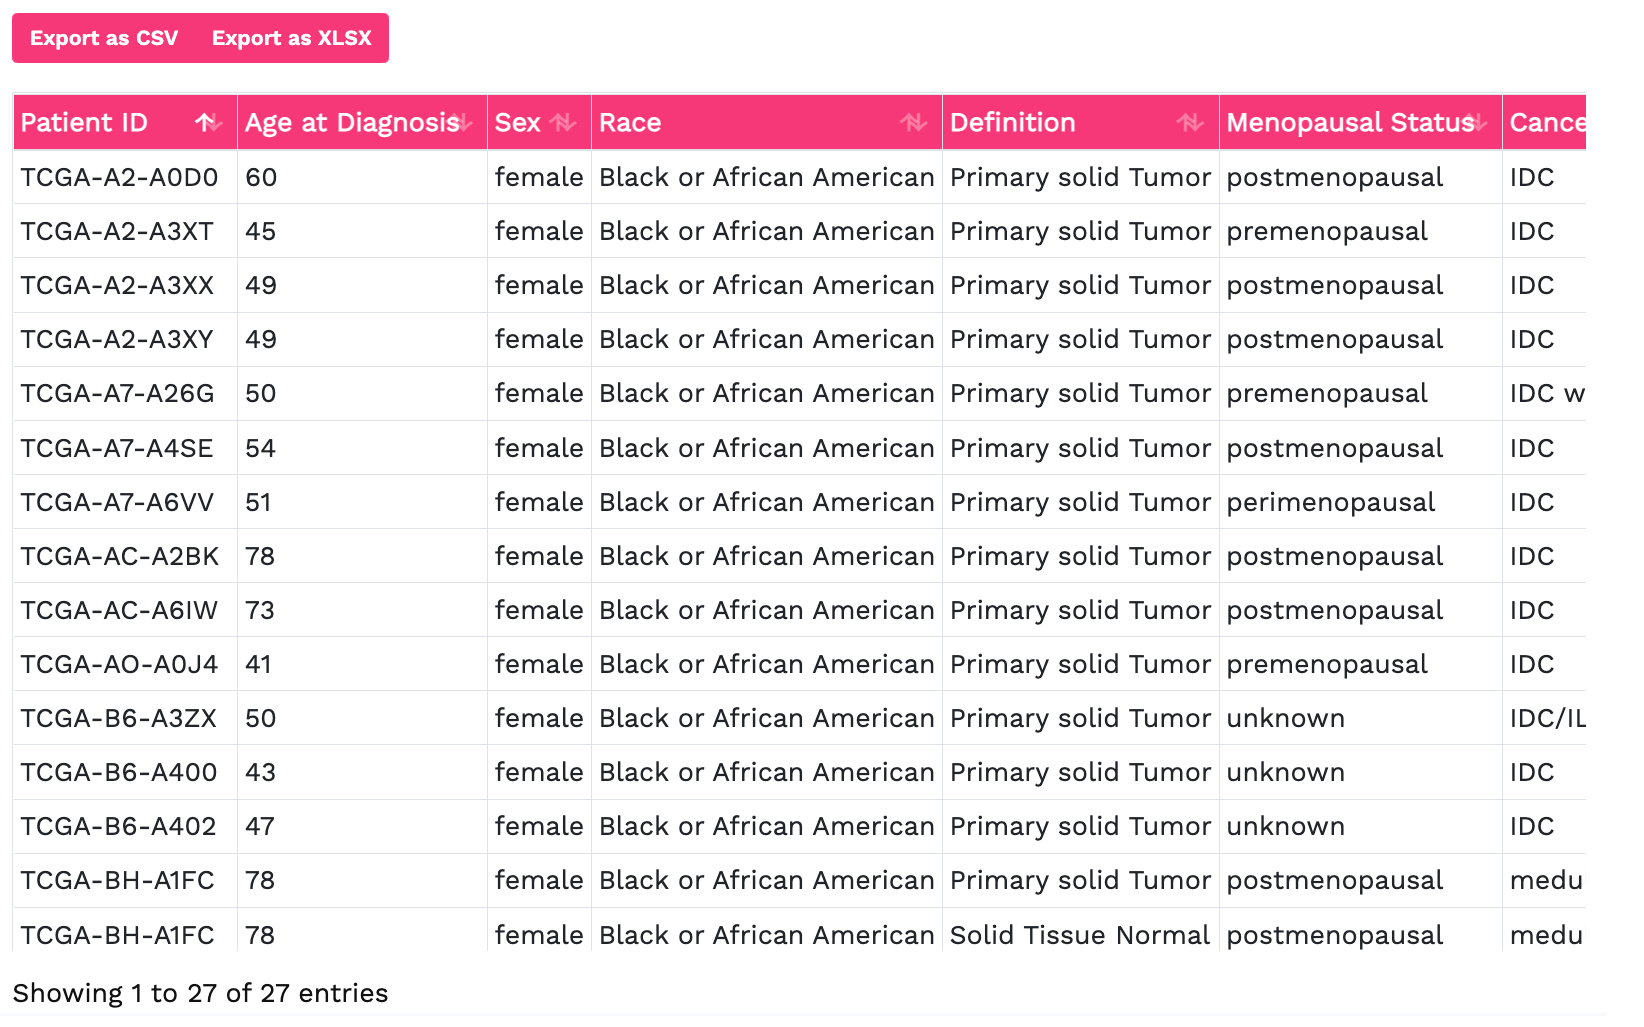
The Cancer Genome Atlas (TCGA). The TCGA is a consortium dedicated to the systematic study of alterations in a variety of human cancers. Currently, mRNA expression and mutation data from the breast cancer (BRCA) cohort are available for analysis from the Analytics Hub, alongside corresponding clinical data. Methylation data will also be available to query shortly.
The International Cancer Genome Consortium (ICGC). The ICGC is focussed on the generation of comprehensive catalogues of genomic abnormalities in tumours from 50 different cancer types. Currently, mRNA expression and mutation data patients sequenced from five breast cancer projects (BRCA-US, BRCA-EU, BRCA-UK, BRCA-FR and BRCA-KR) are available from the Analytics Hub, with DNA copy number and methylation data to be made available shortly.
Cancer Cell Line Encyclopedia (CCLE). The CCLE is an effort to conduct a detailed genetic characterisation of a large panel of human cancer cell lines. mRNA expression and mutation data for breast cancer cell lines are available.


Table 1. Summary of data Sources and Features Available

Source Project Clinical Features Genomics Data Transcriptomics Data
BCNTB GEL
BCNTB Spatial
TCGA BRCA
ICGC BRCA-US
ICGC BRCA-EU
ICGC BRCA-UK
ICGC BRCA-FR
ICGC BRCA-KR
CCLE CCLE
Filters

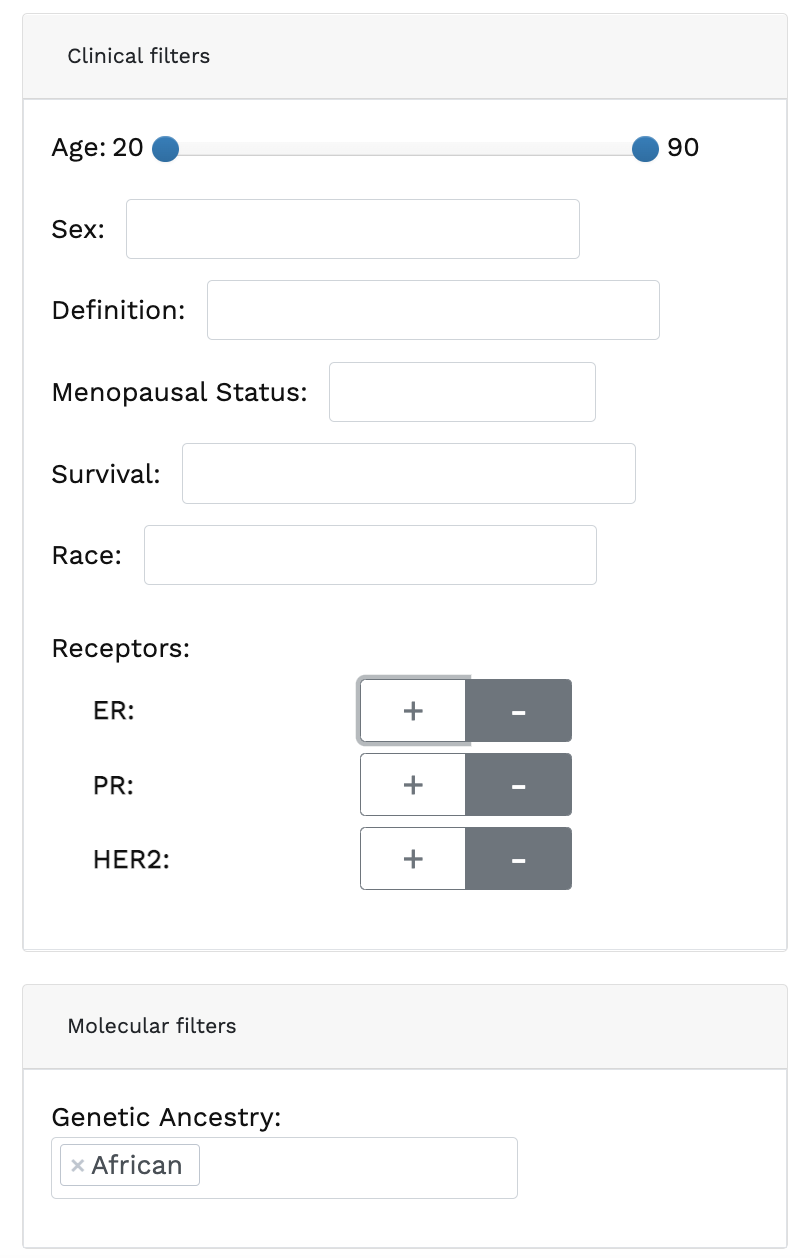
Researchers can filter patients within a project based on clinical and/or molecular attributes available to create a research cohort.

Clinical filters: age, receptor status, sex, ethnicity, menopausal status, family history of disease, survival status, follow-up status, tumour grade.

Molecular filters: genetic ancestry as defined by Genomics England.
Ethnicity is self-reported by patients, however this is often missing, sometimes inaccurate and usually incomplete in healthcare records. Inferred genetic ancestry allows for a detailed ancestral characterisation, obtained by genotyping a patient's DNA from cancer-free tissues. GEL categorises individuals into five super-populations: African (AFR), East Asian (EAS), European (EUR), Admixed American (AMR) and South Asian (SAS). For additional information please click here.

Clinical Summary

OVERVIEW

An overview of key features available from each project are presented as dynamic bar charts. These plots provide quick and simple means to visualise multiple covariates in relation to each other and identify potential trends in the data.

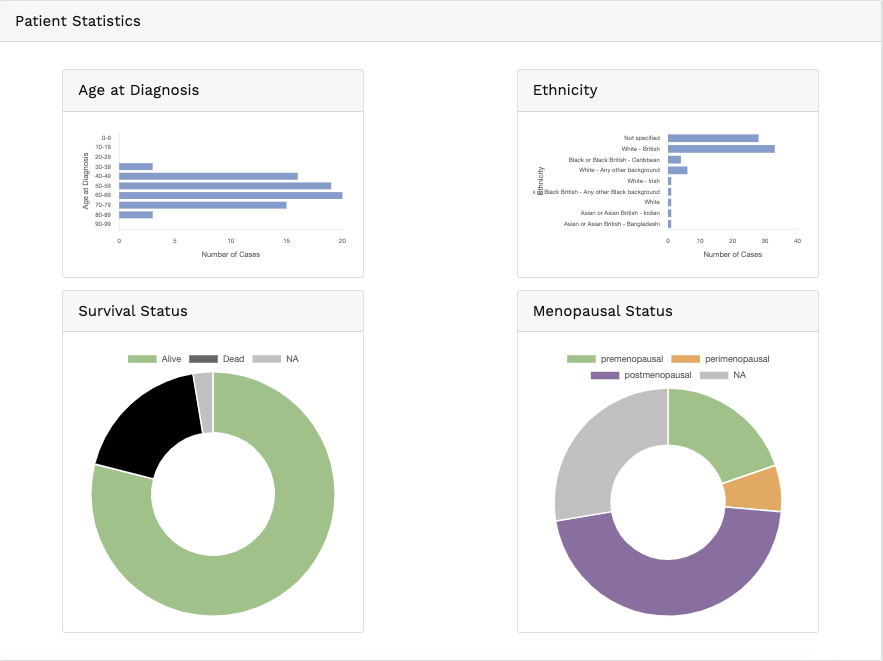
PATIENT STATISTICS

The main patient (demographic and clinical) features are summarised in this section.

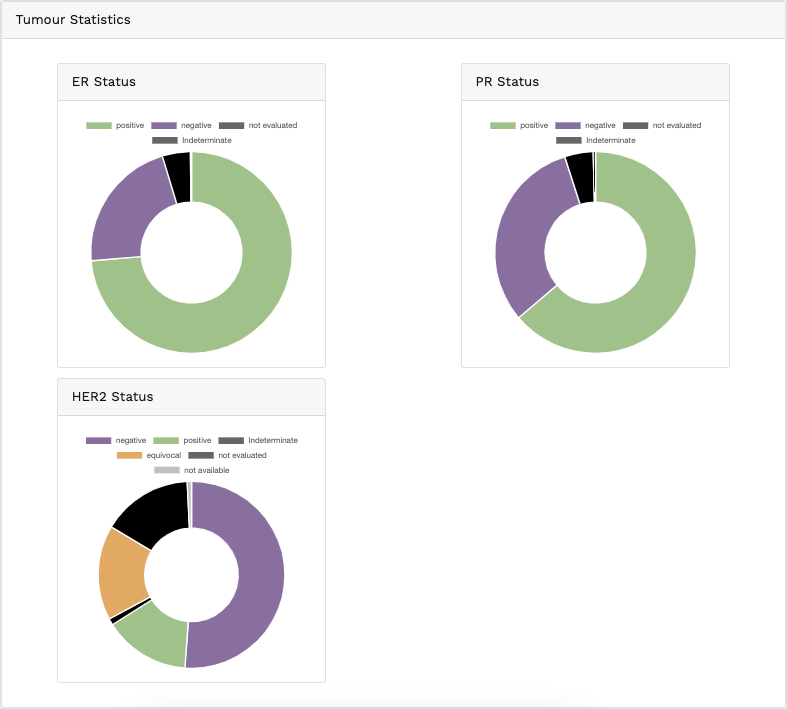
TUMOUR STATISTICS

Key tumour statistics are available for projects that provide clinical/pathological evaluations of the tumours.

Genomics

Genomics data from publicly available sequencing cohorts can be analysed using the integrated Bioconductor package MAFtools, which facilitates the analysis of somatic variants containing single-nucleotide variants (SNV) and small insertion/deletions (indels), based on variant characteristics, gene interactions and protein changes.


VARIANT IDENTIFICATION

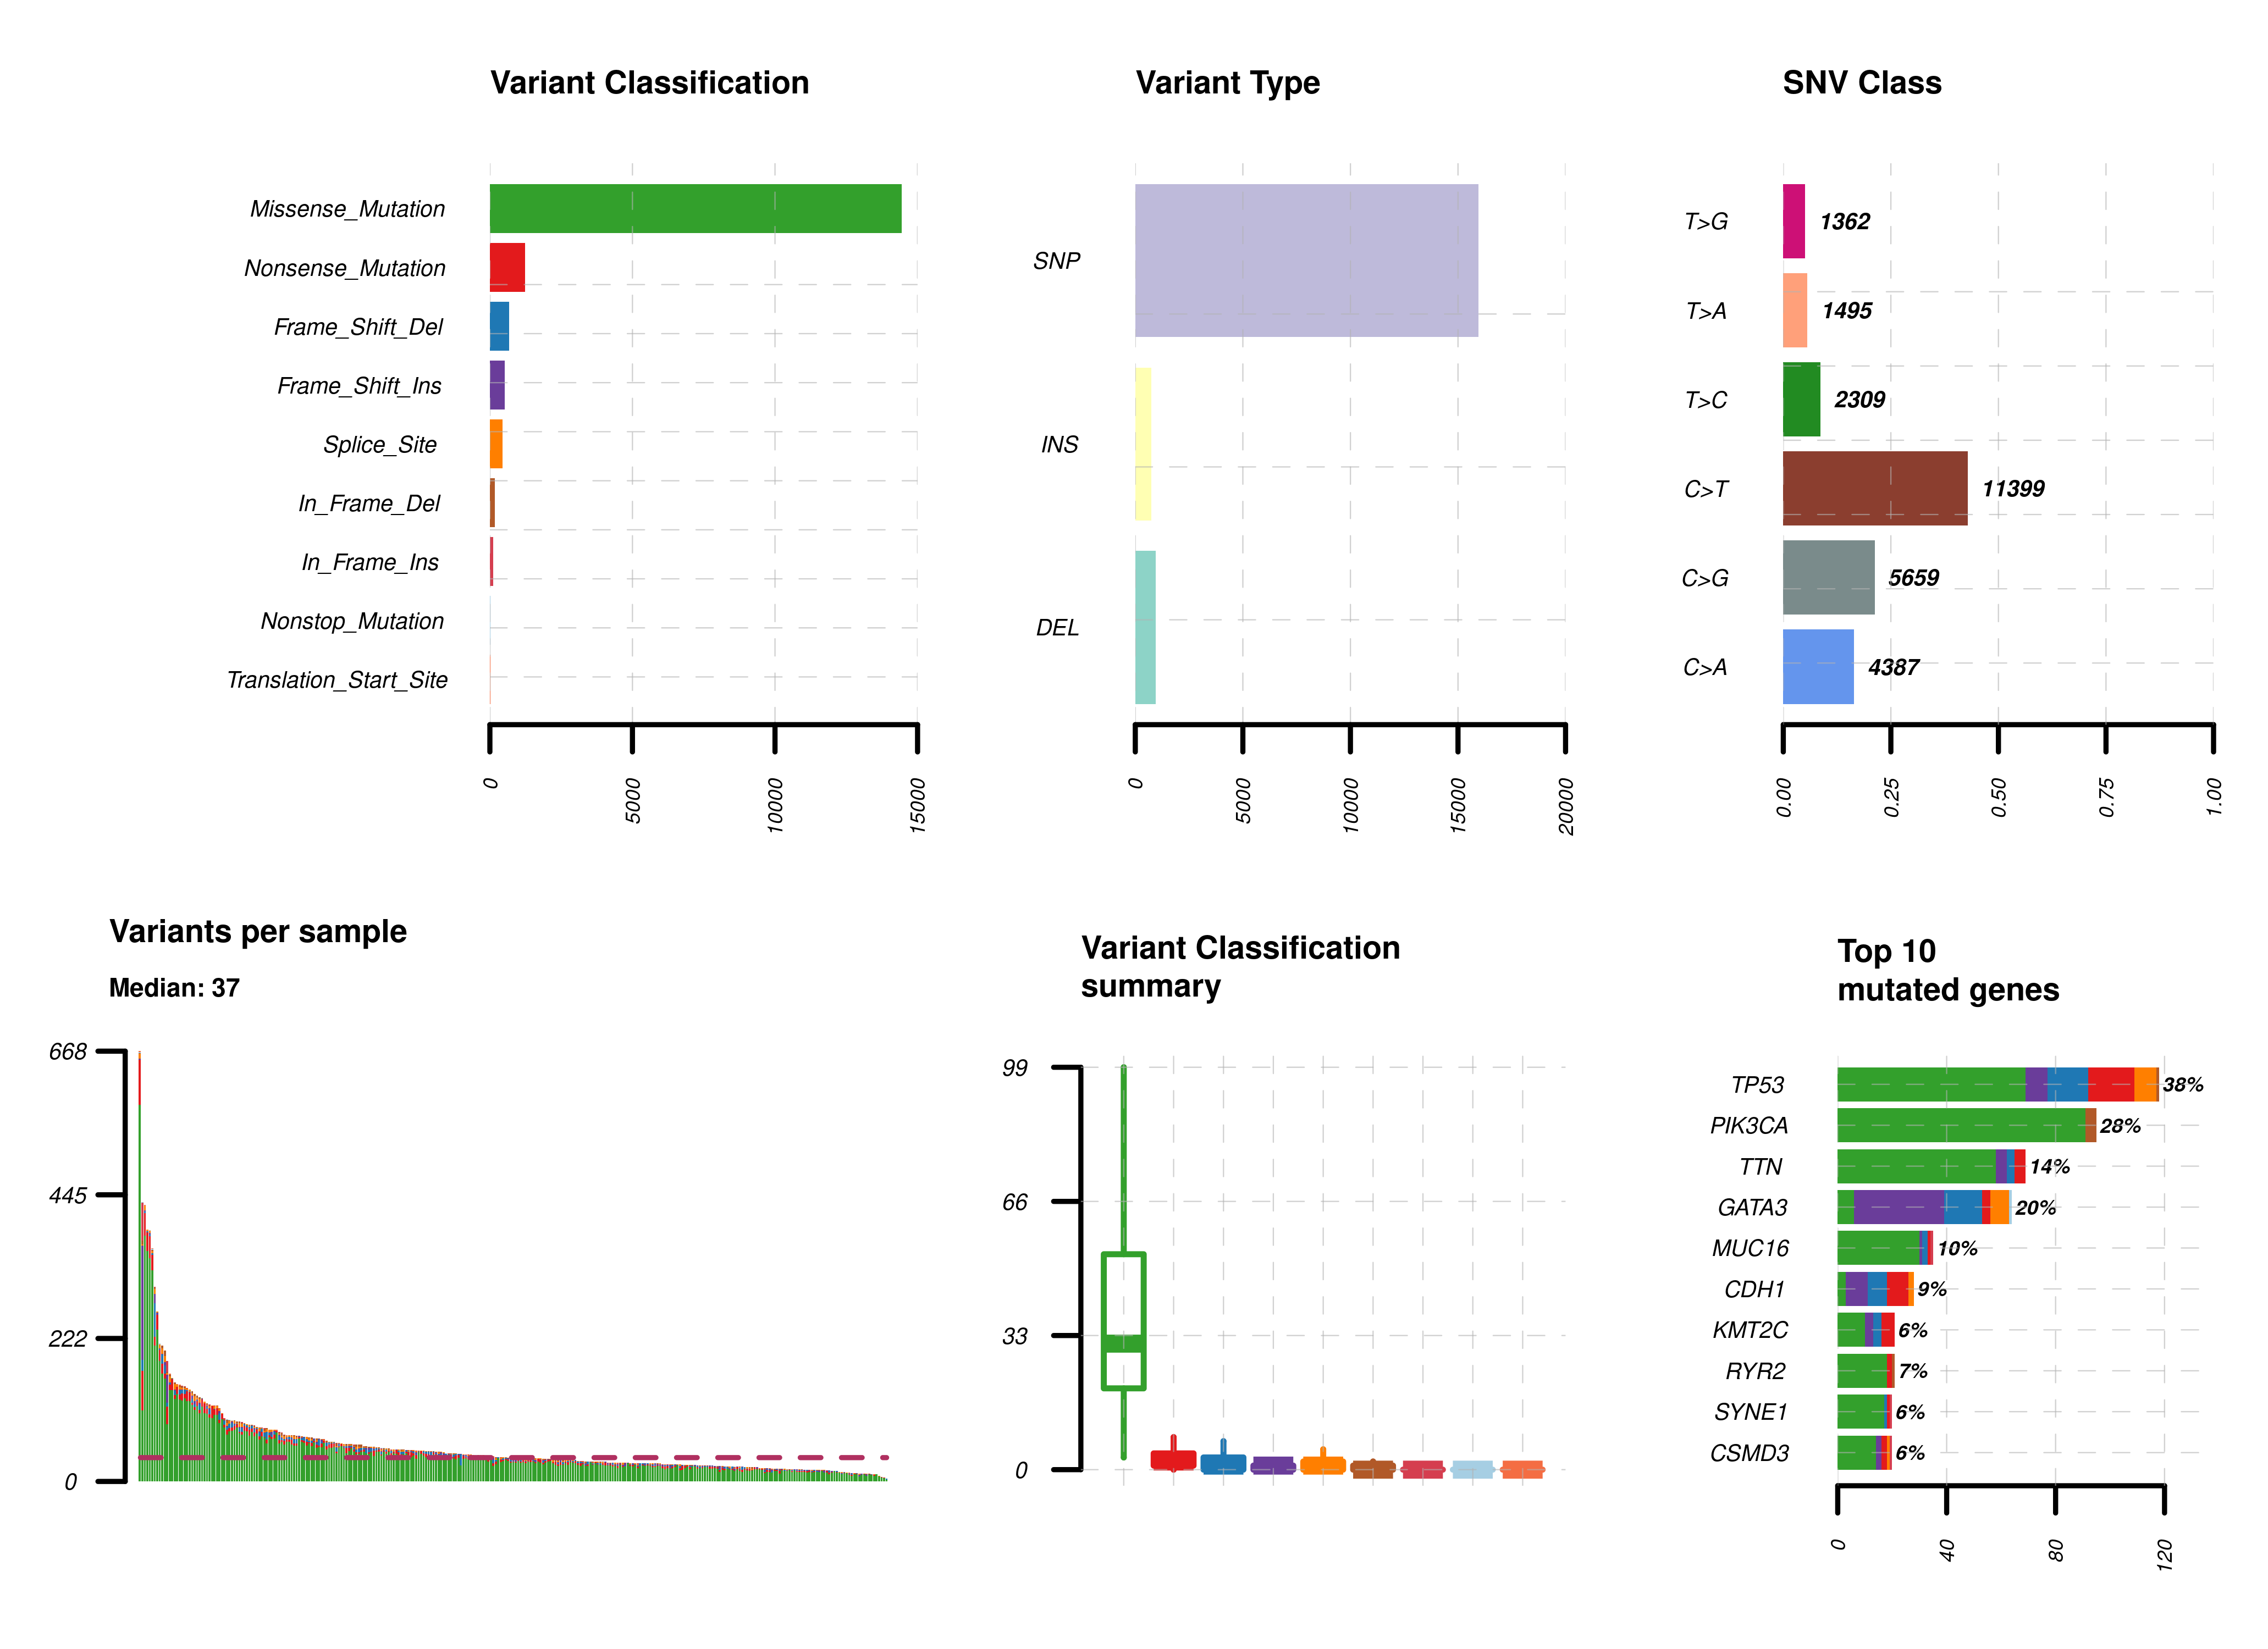
Summary. A MAFtools summary plot is generated for each cohort, displaying the range of variant classifications, variant types and base substitution profiles as bar plots and/or box plots. The number of variants in each sample can also be viewed as a stacked bar plot, alongside a summary of the top 10 mutated genes for each cohort.
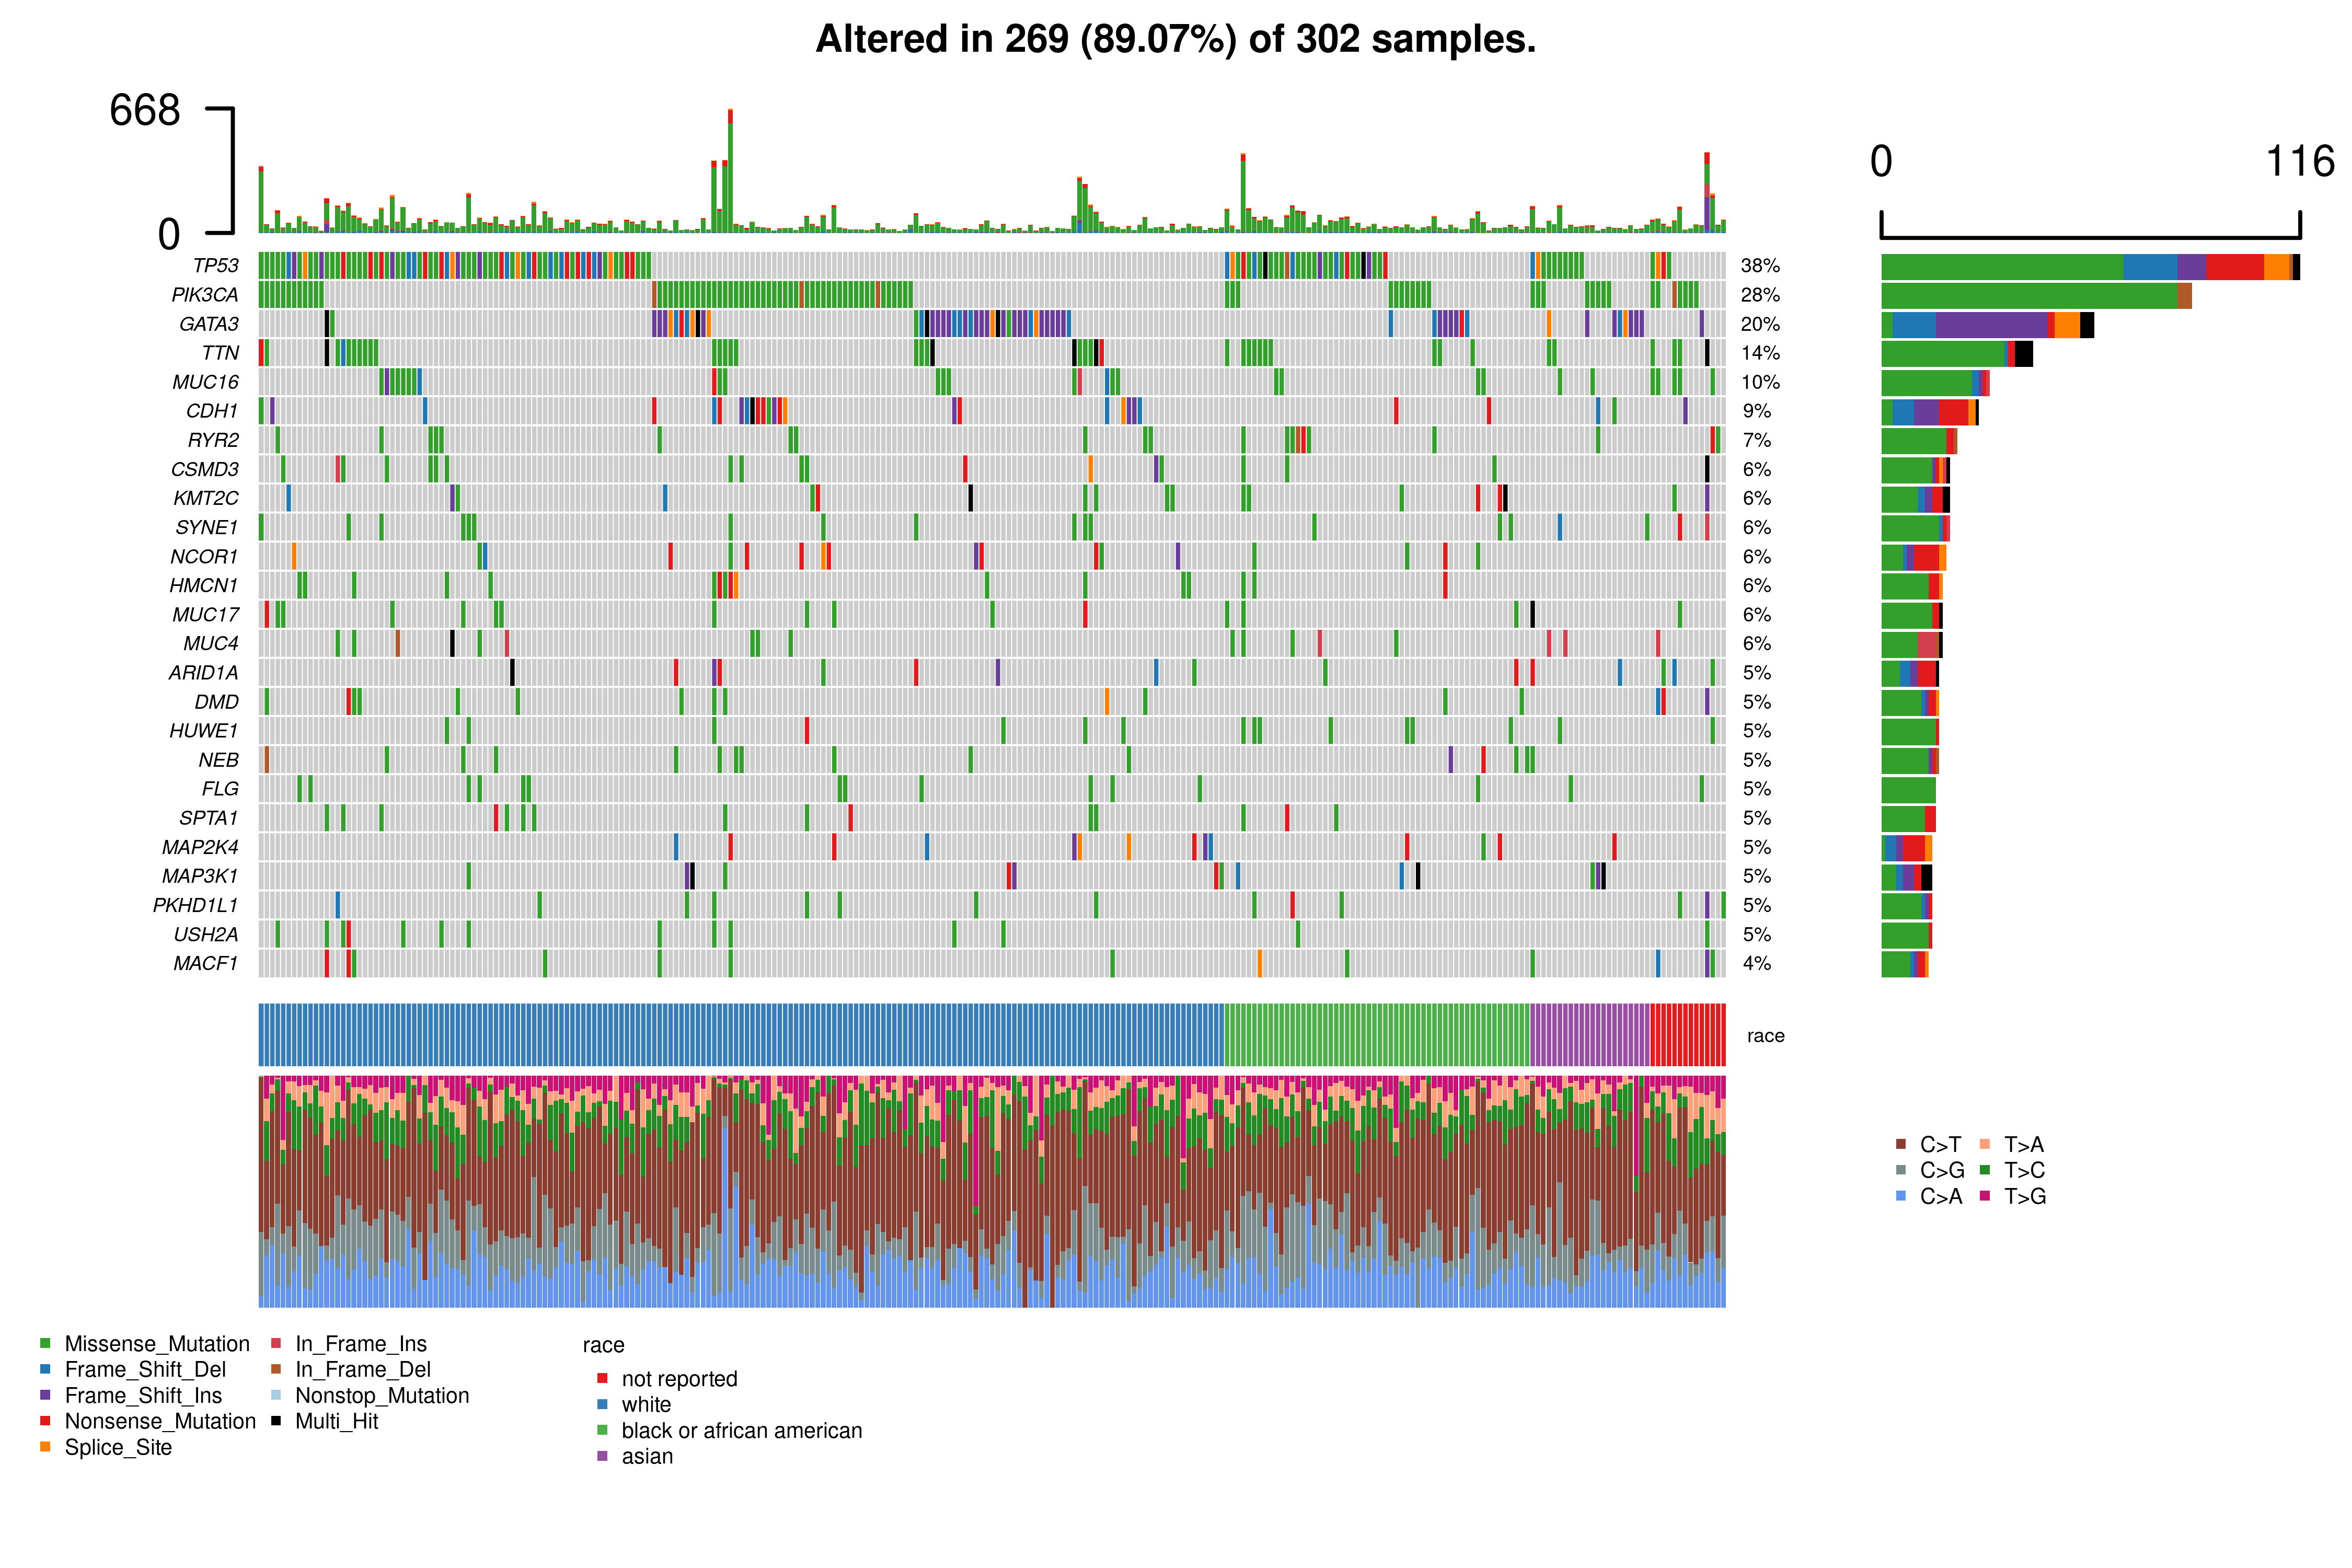
Oncoplot. The oncoplot allows users to explore the mutational landscape of the top mutated genes in the cohort defined.
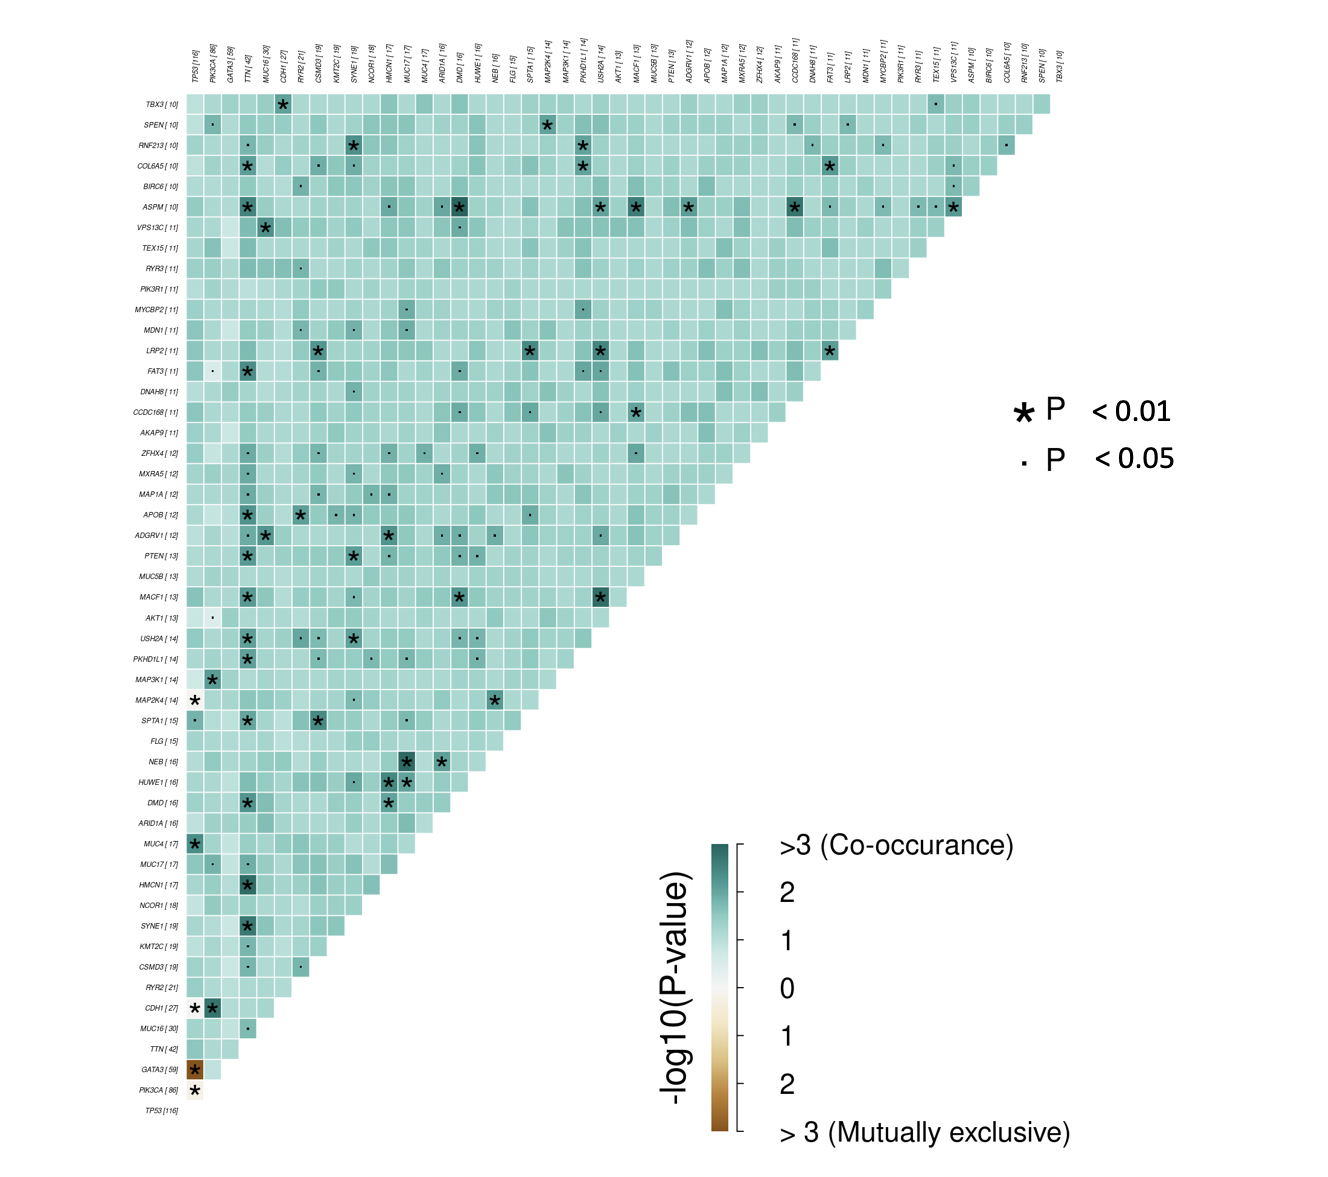
Somatic Interactions. Pair-wise Fisher’s Exact test is performed on the top 25 genes to detect mutually exclusive or co-occuring genes and presented as a correlation matrix (where * is p<0.01 and . is p<0.05).
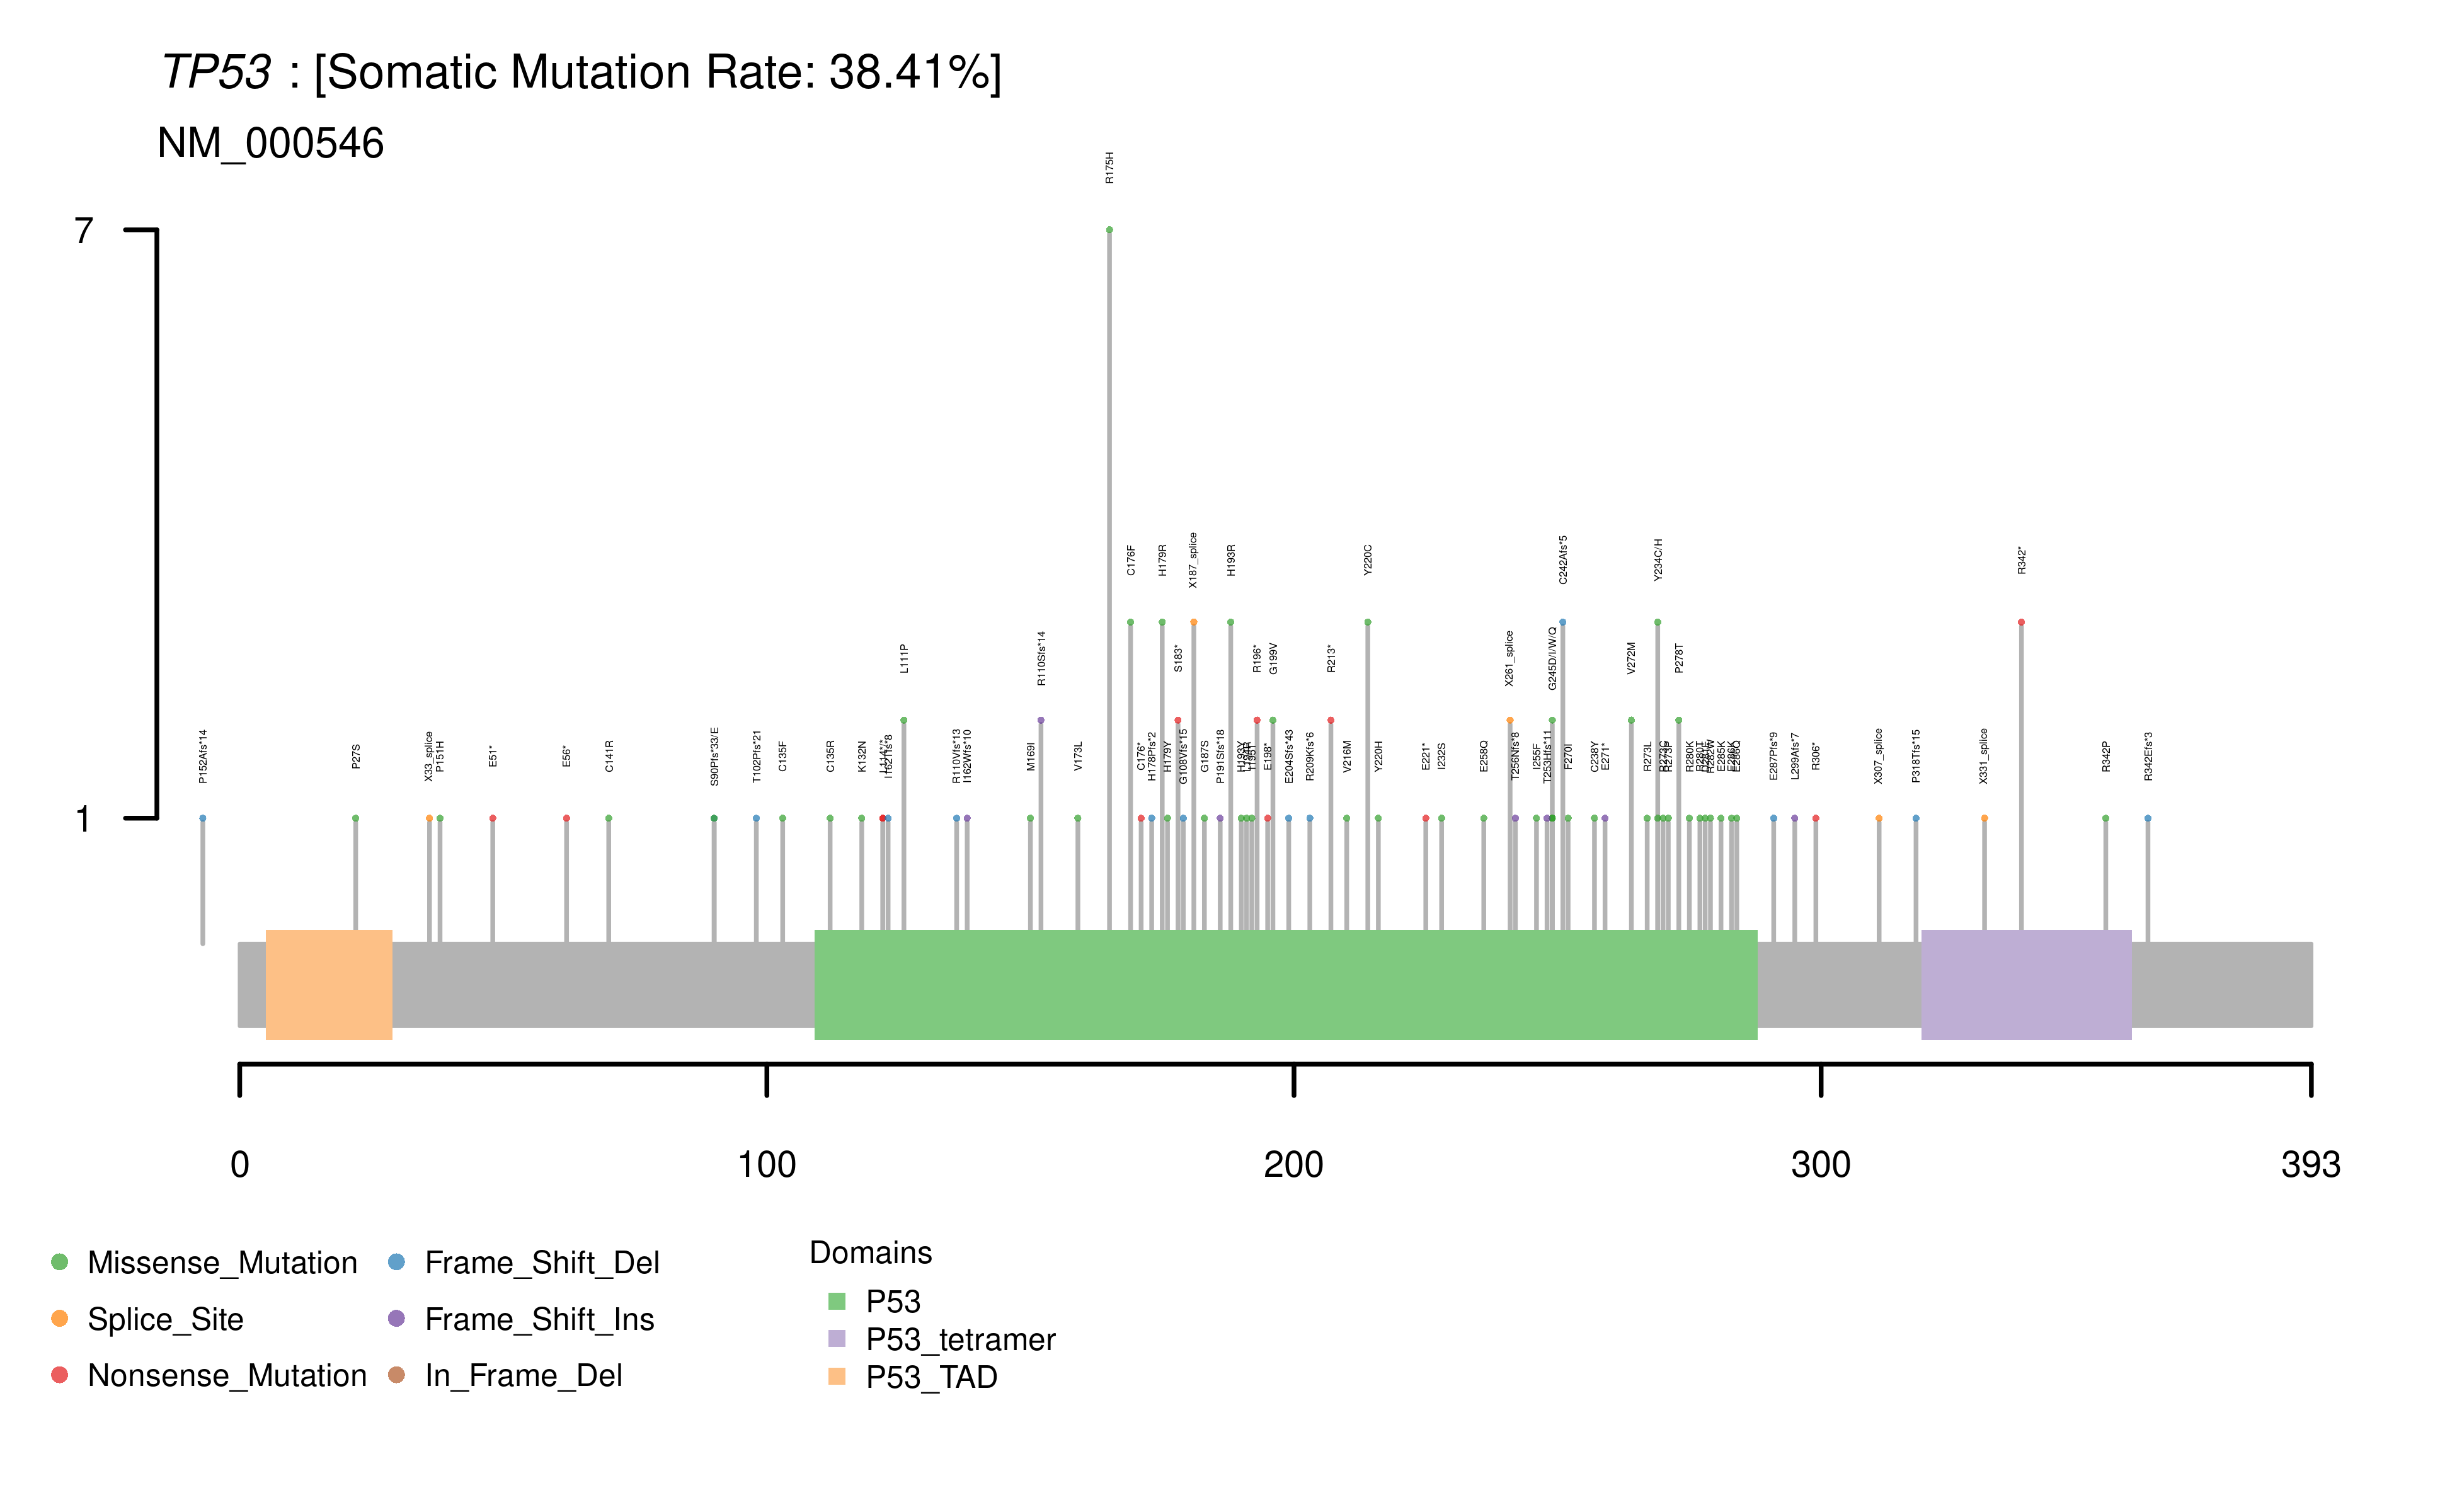
Lolliplot. Users can also select to view amino acid changes within each of the top 50 mutated genes in each cohort as a lollipop plot. These plots display the observed mutation distribution and protein domains, which are labelled for each selected gene. A summary of the observed somatic mutation rate for each selected gene is also provided alongside each plot.
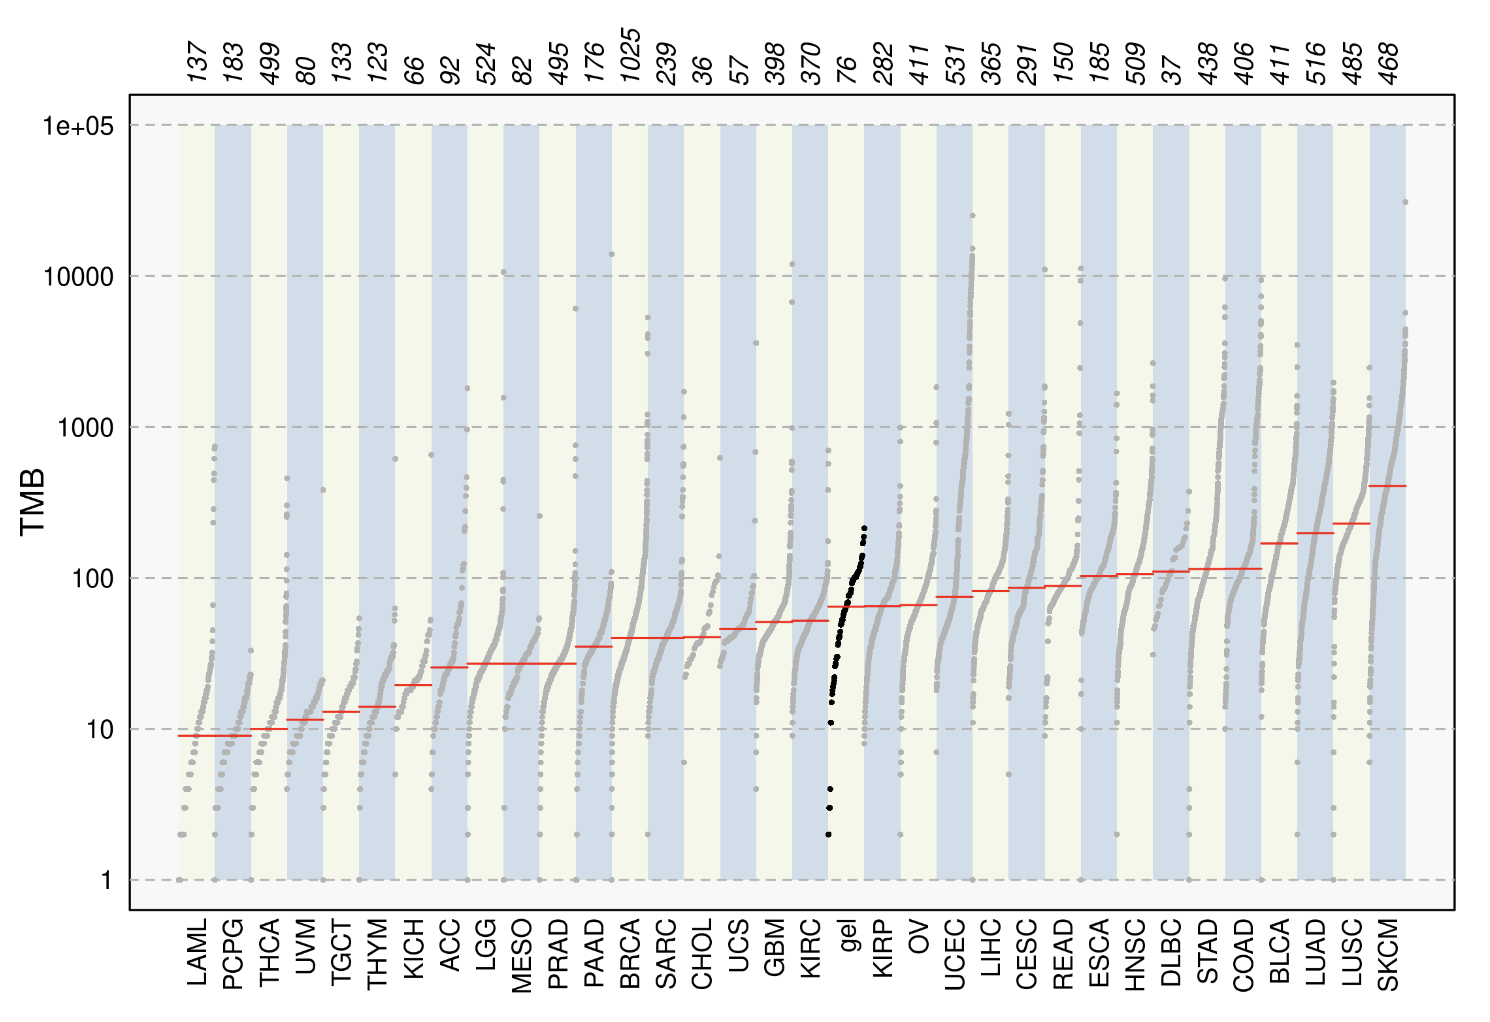
TCGA Compare. Researchers can compare the tumour mutational burden of their selected cohort to that of 33 independent TCGA cohorts derived from the MC3 Project.

DRUG PREDICTIONS

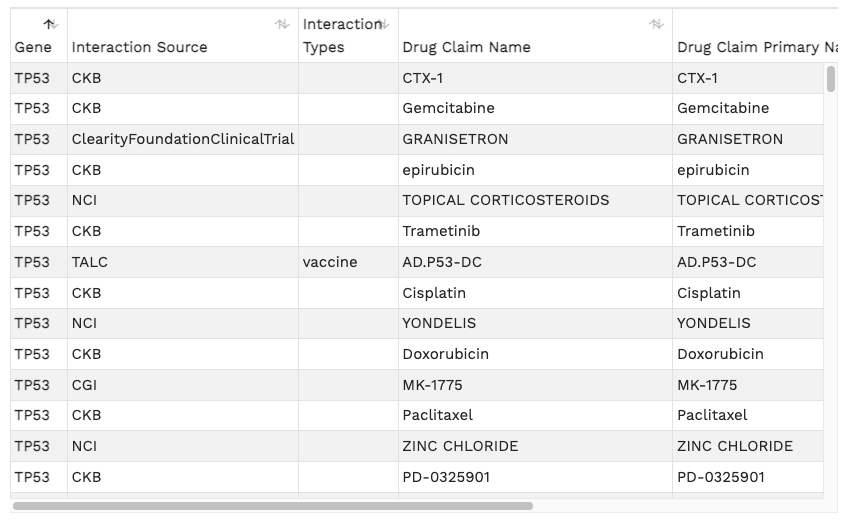
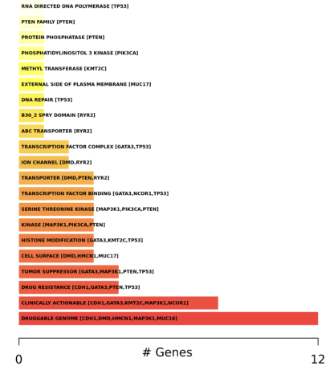
Drug-Gene interactions. The barplots present known/reported drug interactions or druggable categories compiled from the Drug Interaction Database. These results are also presented in a searchable tabular format.

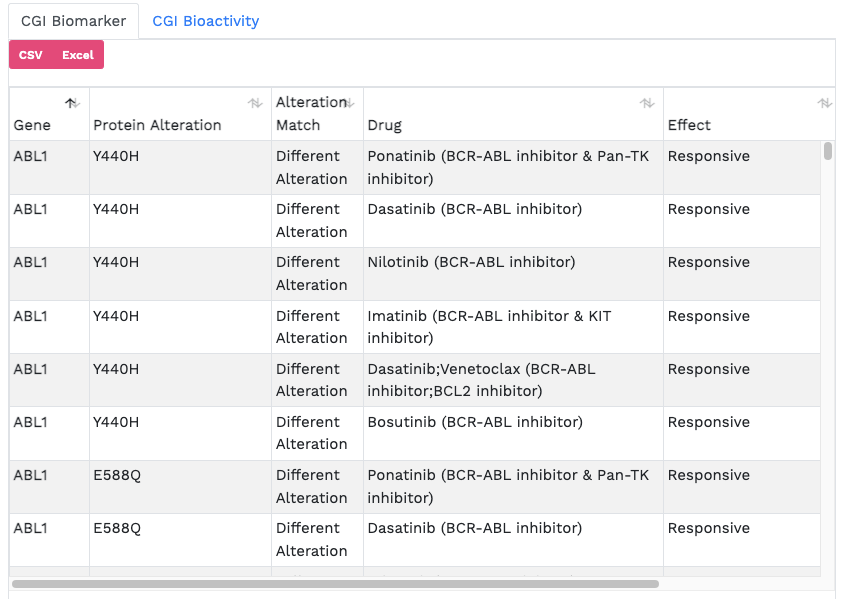
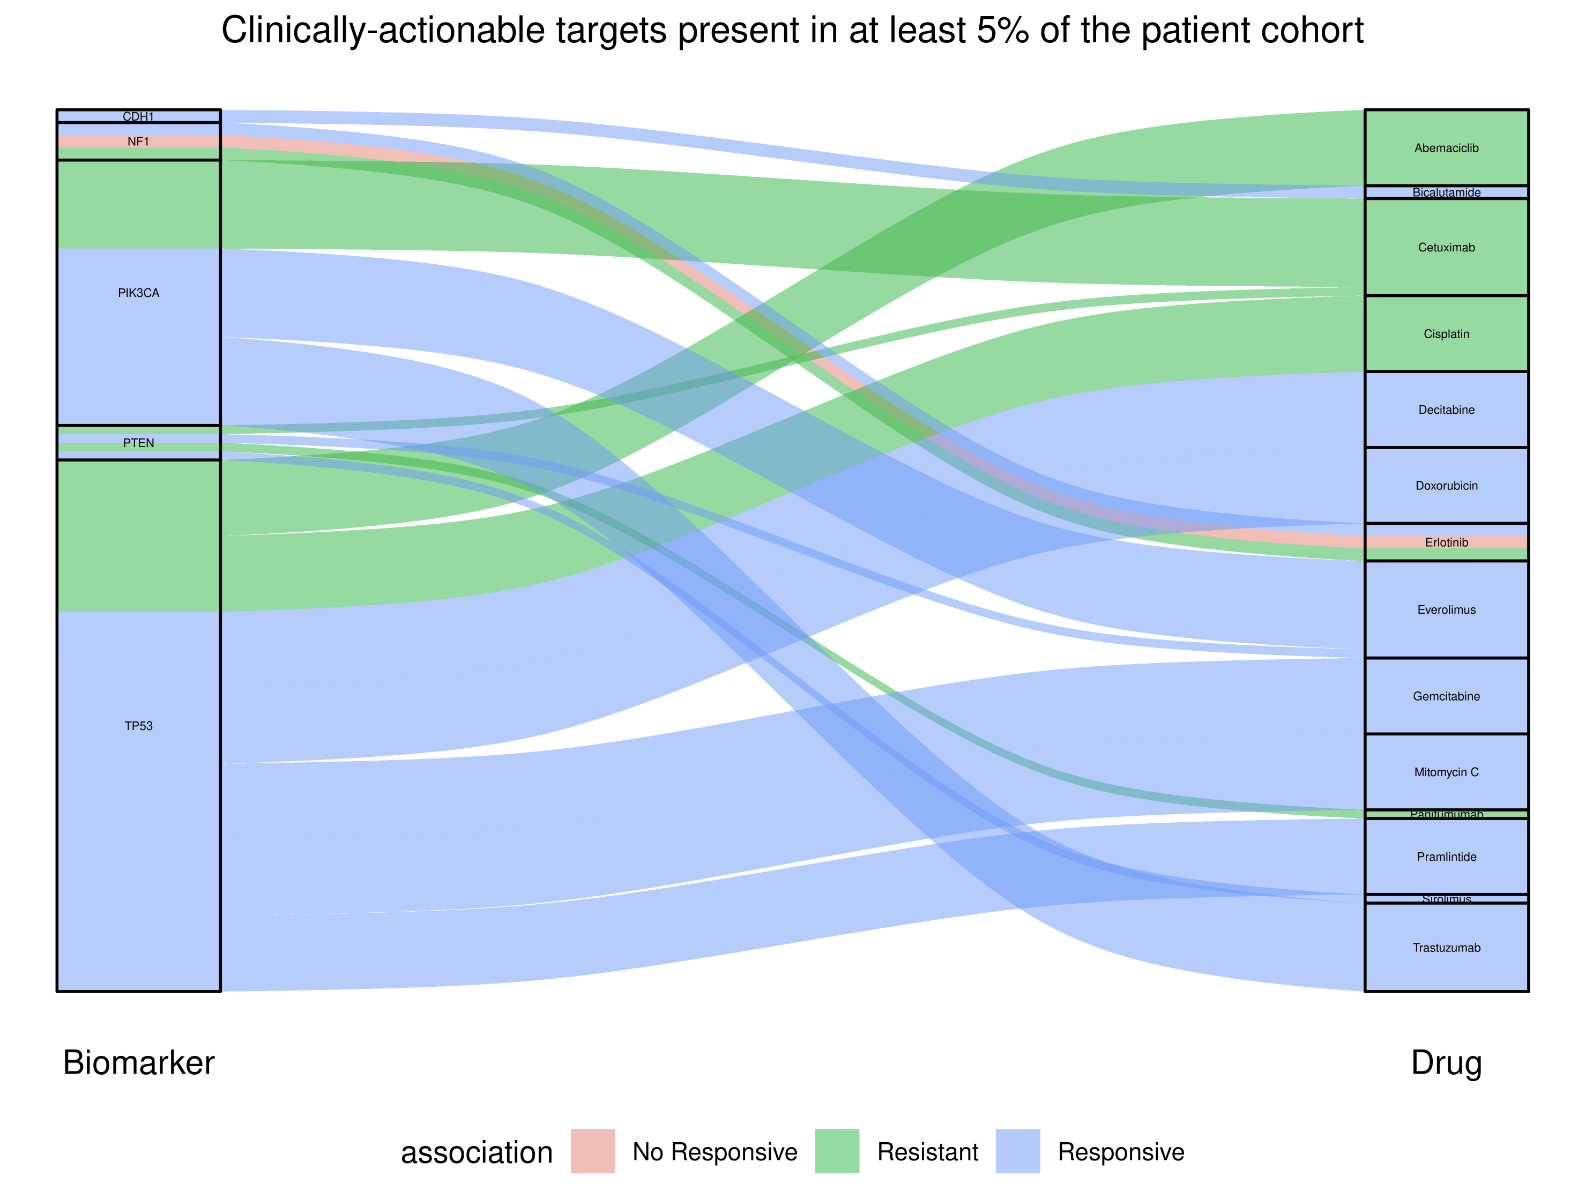
Cancer Genome Interpreter (CGI). The CGI is a third-party tool developed to help in the interpretation of sequenced cancer genomes, assessing the potential of somatic alterations to act as tumour drivers and the possible effect on treatment response. The Analytics Hub presents potential cancer driver mutations from the user-selected cohort in tabular format and highlights those that may be therapeutically actionable in an alluvial plot.


INTERACTIONS AND PATHWAYS

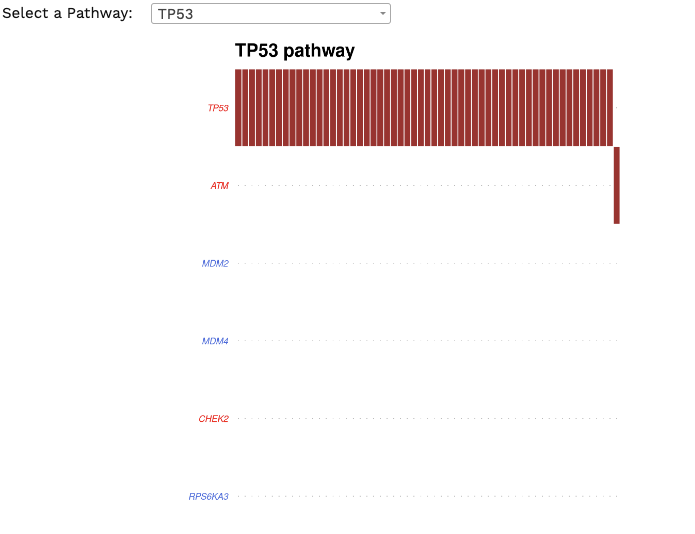
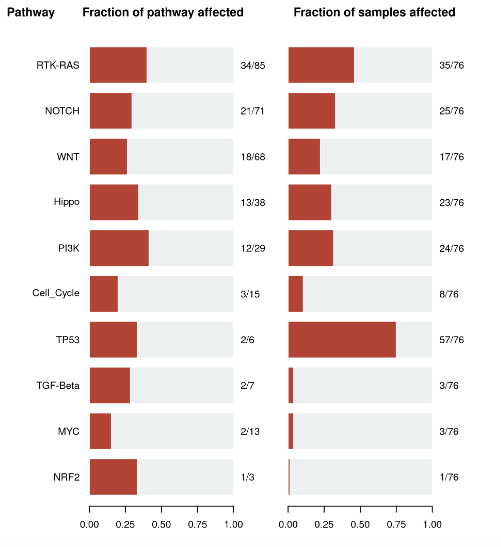
Oncogenic Pathways. Displays an summary of enriched oncogenic signalling pathways (as developed from TCGA projects) present in the cohort. Researchers can focus on a pathway of interest, with each red box representing a patient and gene names coloured by potential function (tumour supressor genes in red and oncogenes in blue)

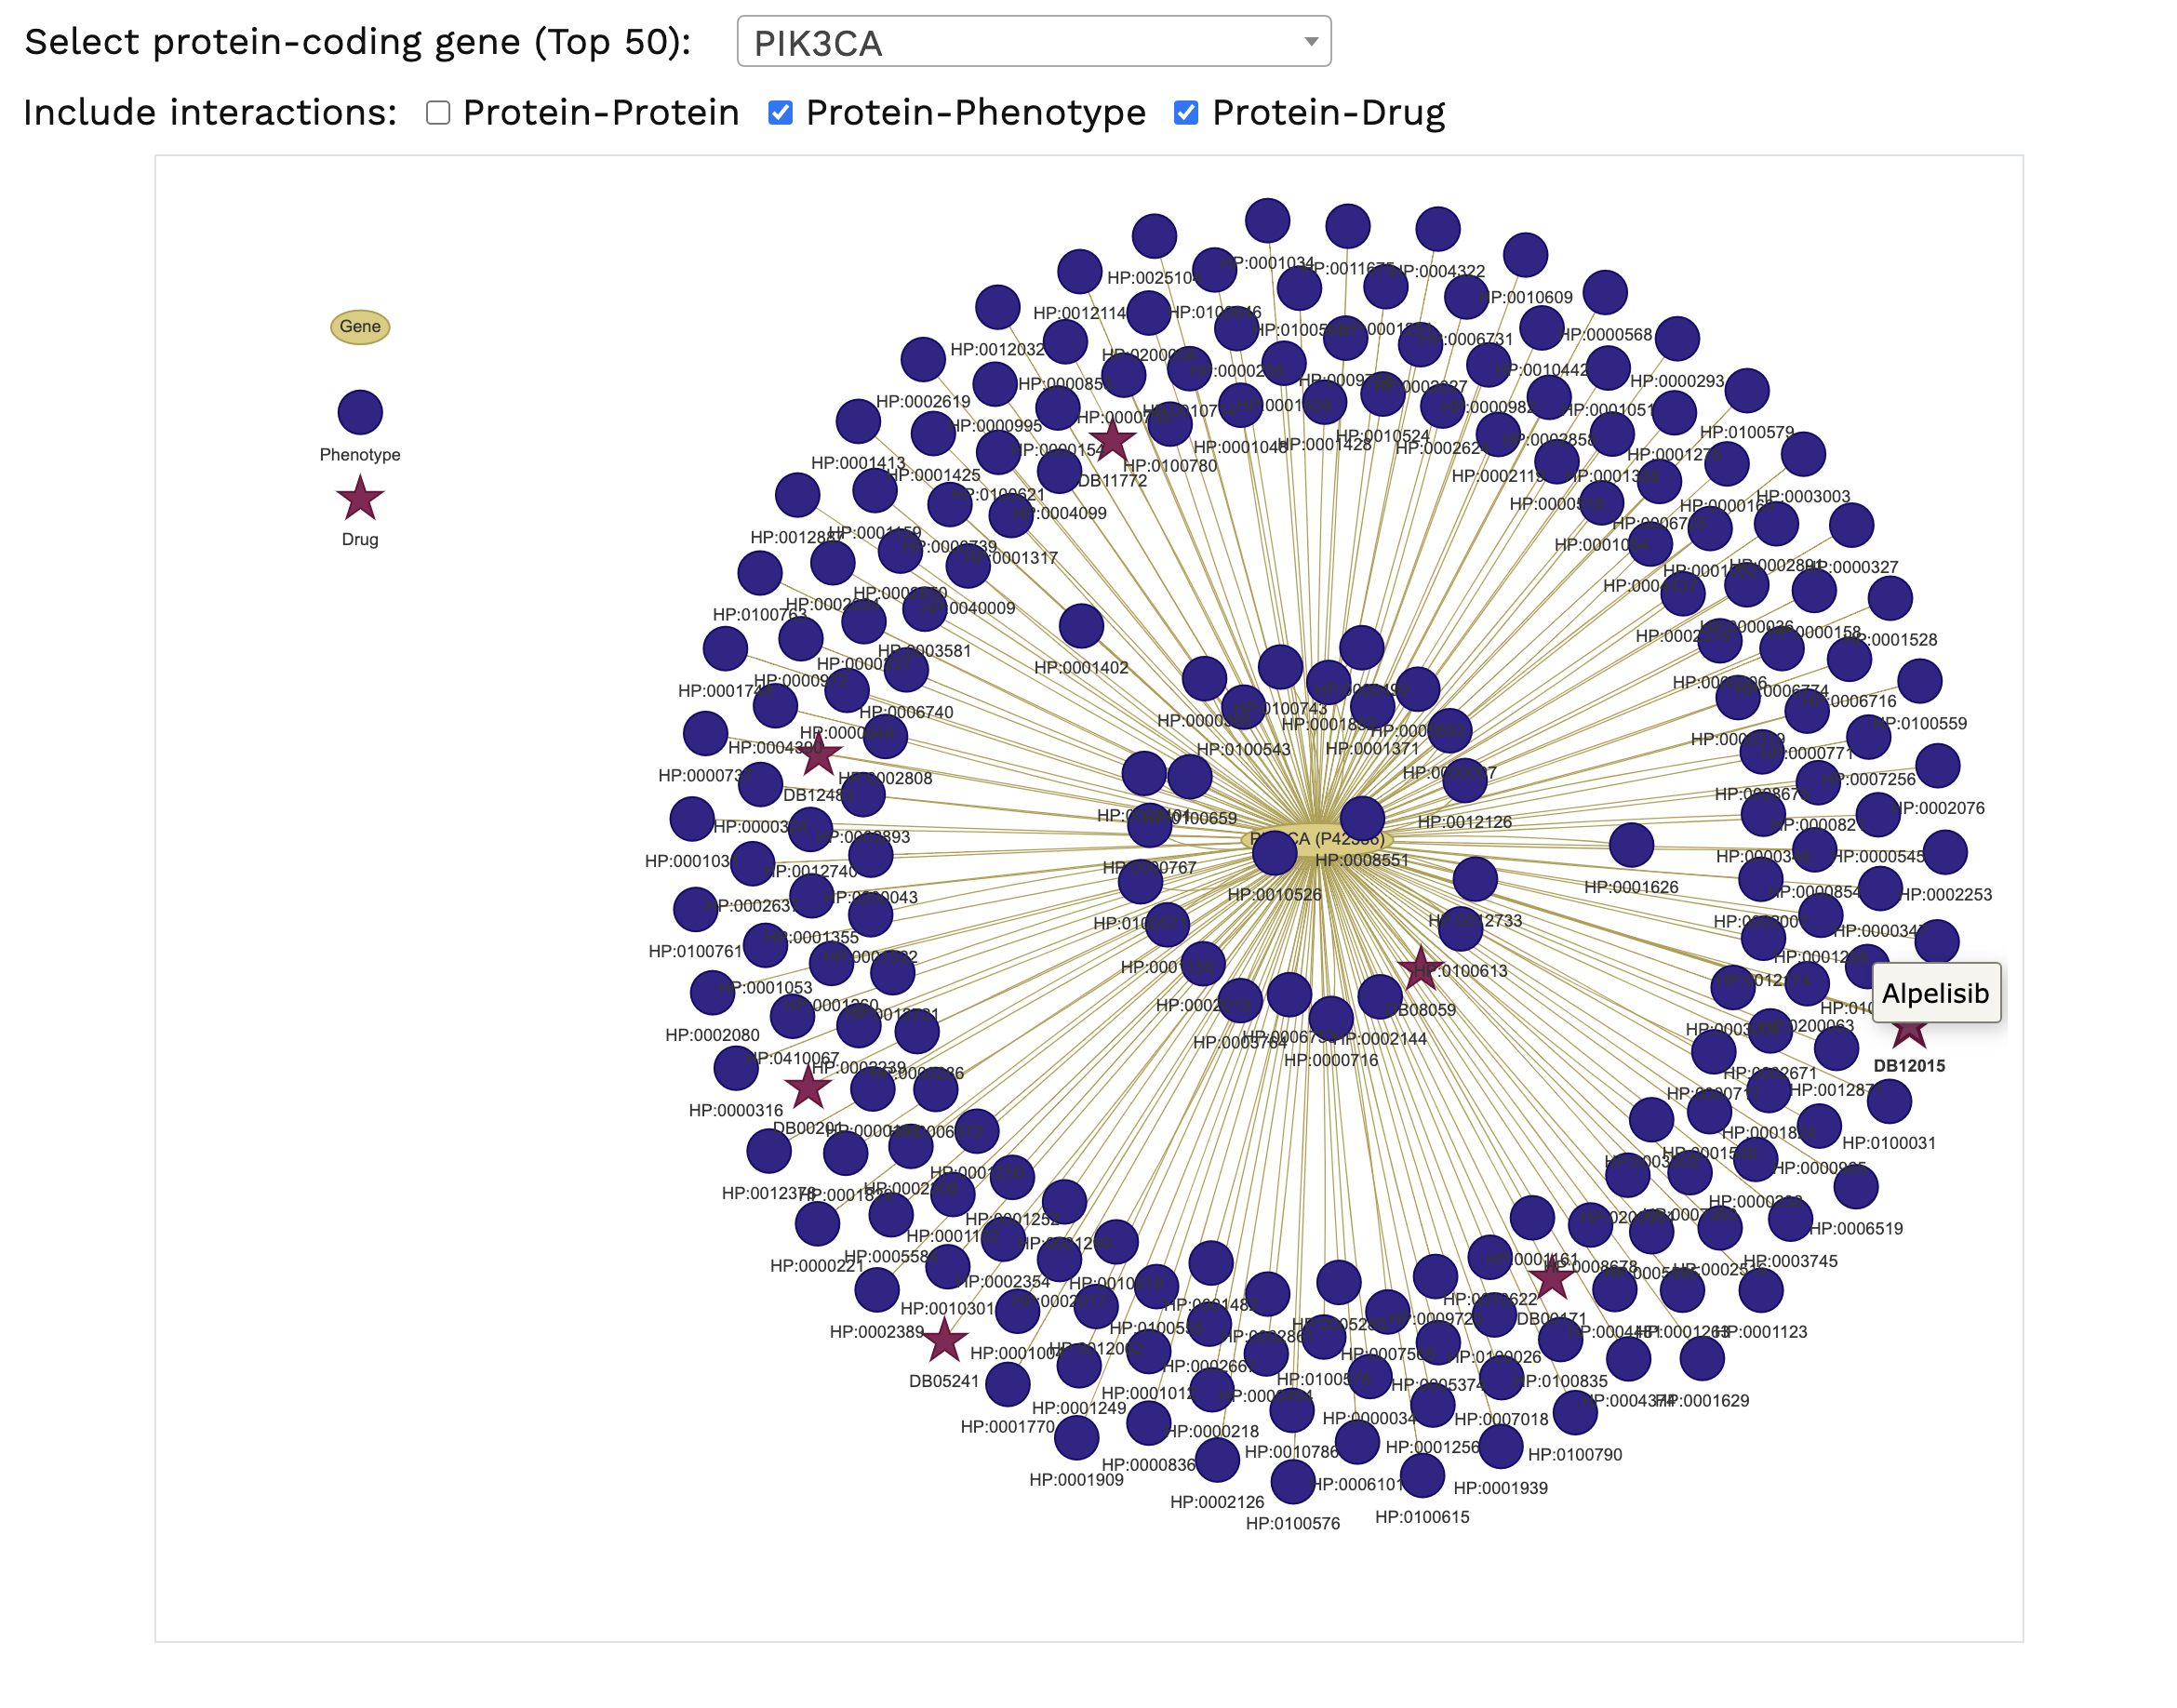
Protein-Protein and Drug-Target Interactions. The characterisation of drug-target interaction networks can provide an important tool to identify potential targets amenable to treatment with existing drugs. The networks available are based on the protein-protein and protein-drug interactions. Variants within candidate genes of interest can be queried against the DrugBank database, for the analysis of potential genotype-driven therapeutic targets.
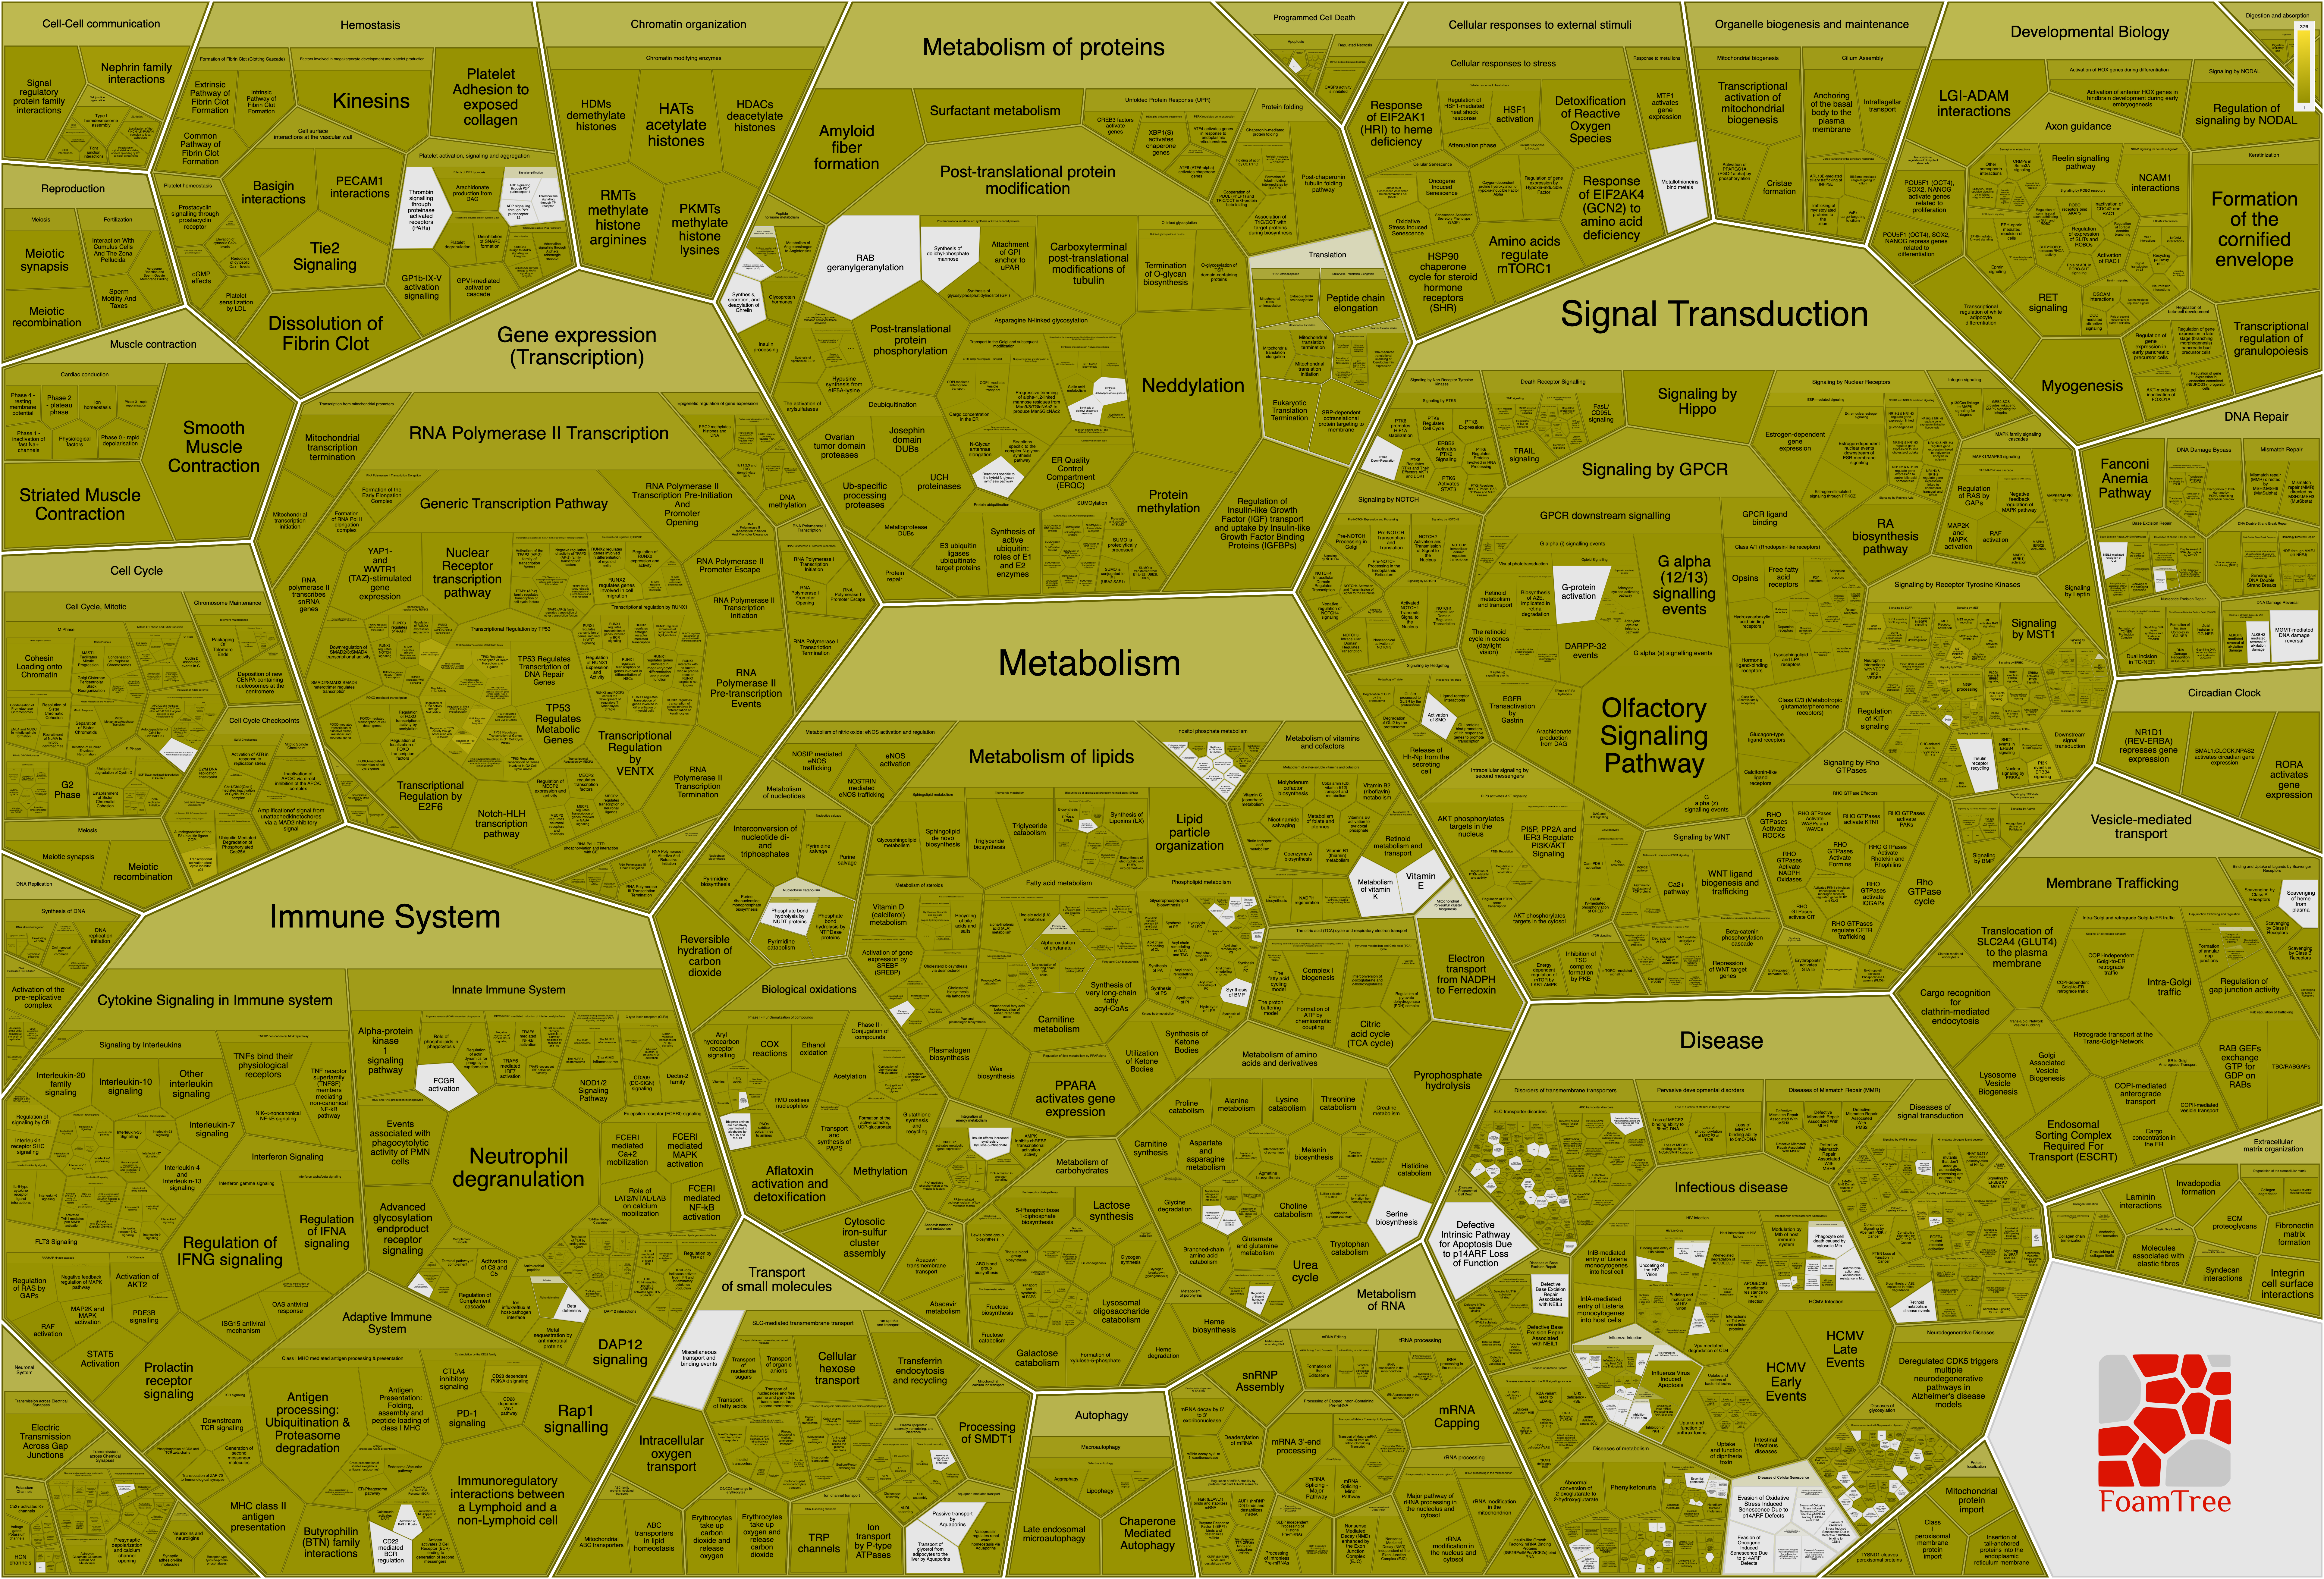
Reactome Pathways. For each query set, variants identified are mapped to their genes. These genes are then linked to their associated biological pathway(s), with results provided in both tabular format and as a link to an interactive Voronoi diagram. The intensity of the yellow color scale represents the number of patients in the selected cohort for which the pathway is affected.
Transcriptomics

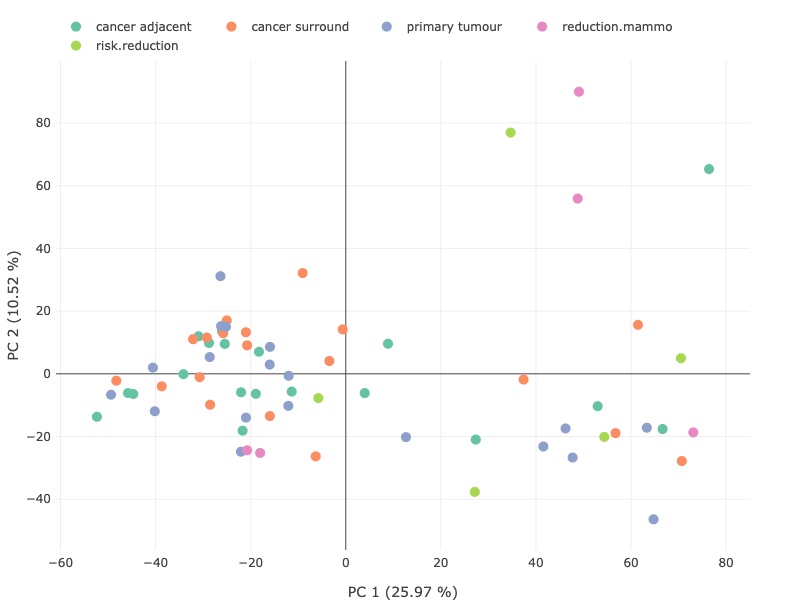
Principal Component Analysis (PCA). PCA reduces the dimensionality of data while retaining the main sources of variation in the dataset, making it possible to visually assess similarities and differences between different samples and determine whether groupings can be identified between individual samples. This exploratory analysis facilitates identification of the key factors affecting the variability in the mRNA expression data.
For each dataset, scatterplots representing the first two and the first three principal components (PCs) of the data are presented. Each data point represents the orientation of a single sample in the transcriptomic space projected on the PCA, with different colours indicating the biological group to which each sample belongs. The percentage values in brackets on each axis indicate the amount of variance in the data explained by the corresponding PC.
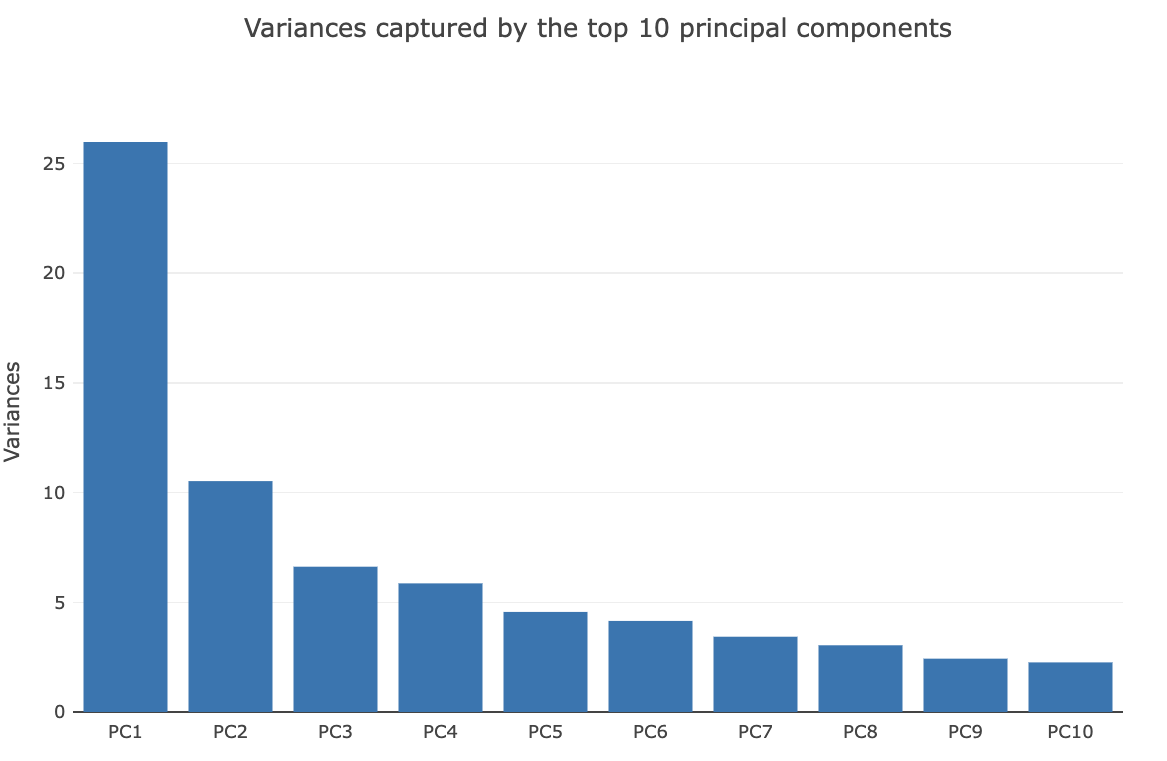
The variability of the data across can be assessed from the scree plot. The fraction of total variance (y-axis) attributed to each PC (x-axis) is presented for the top 10 PCs, ordered by decreasing order of contribution to total variance.


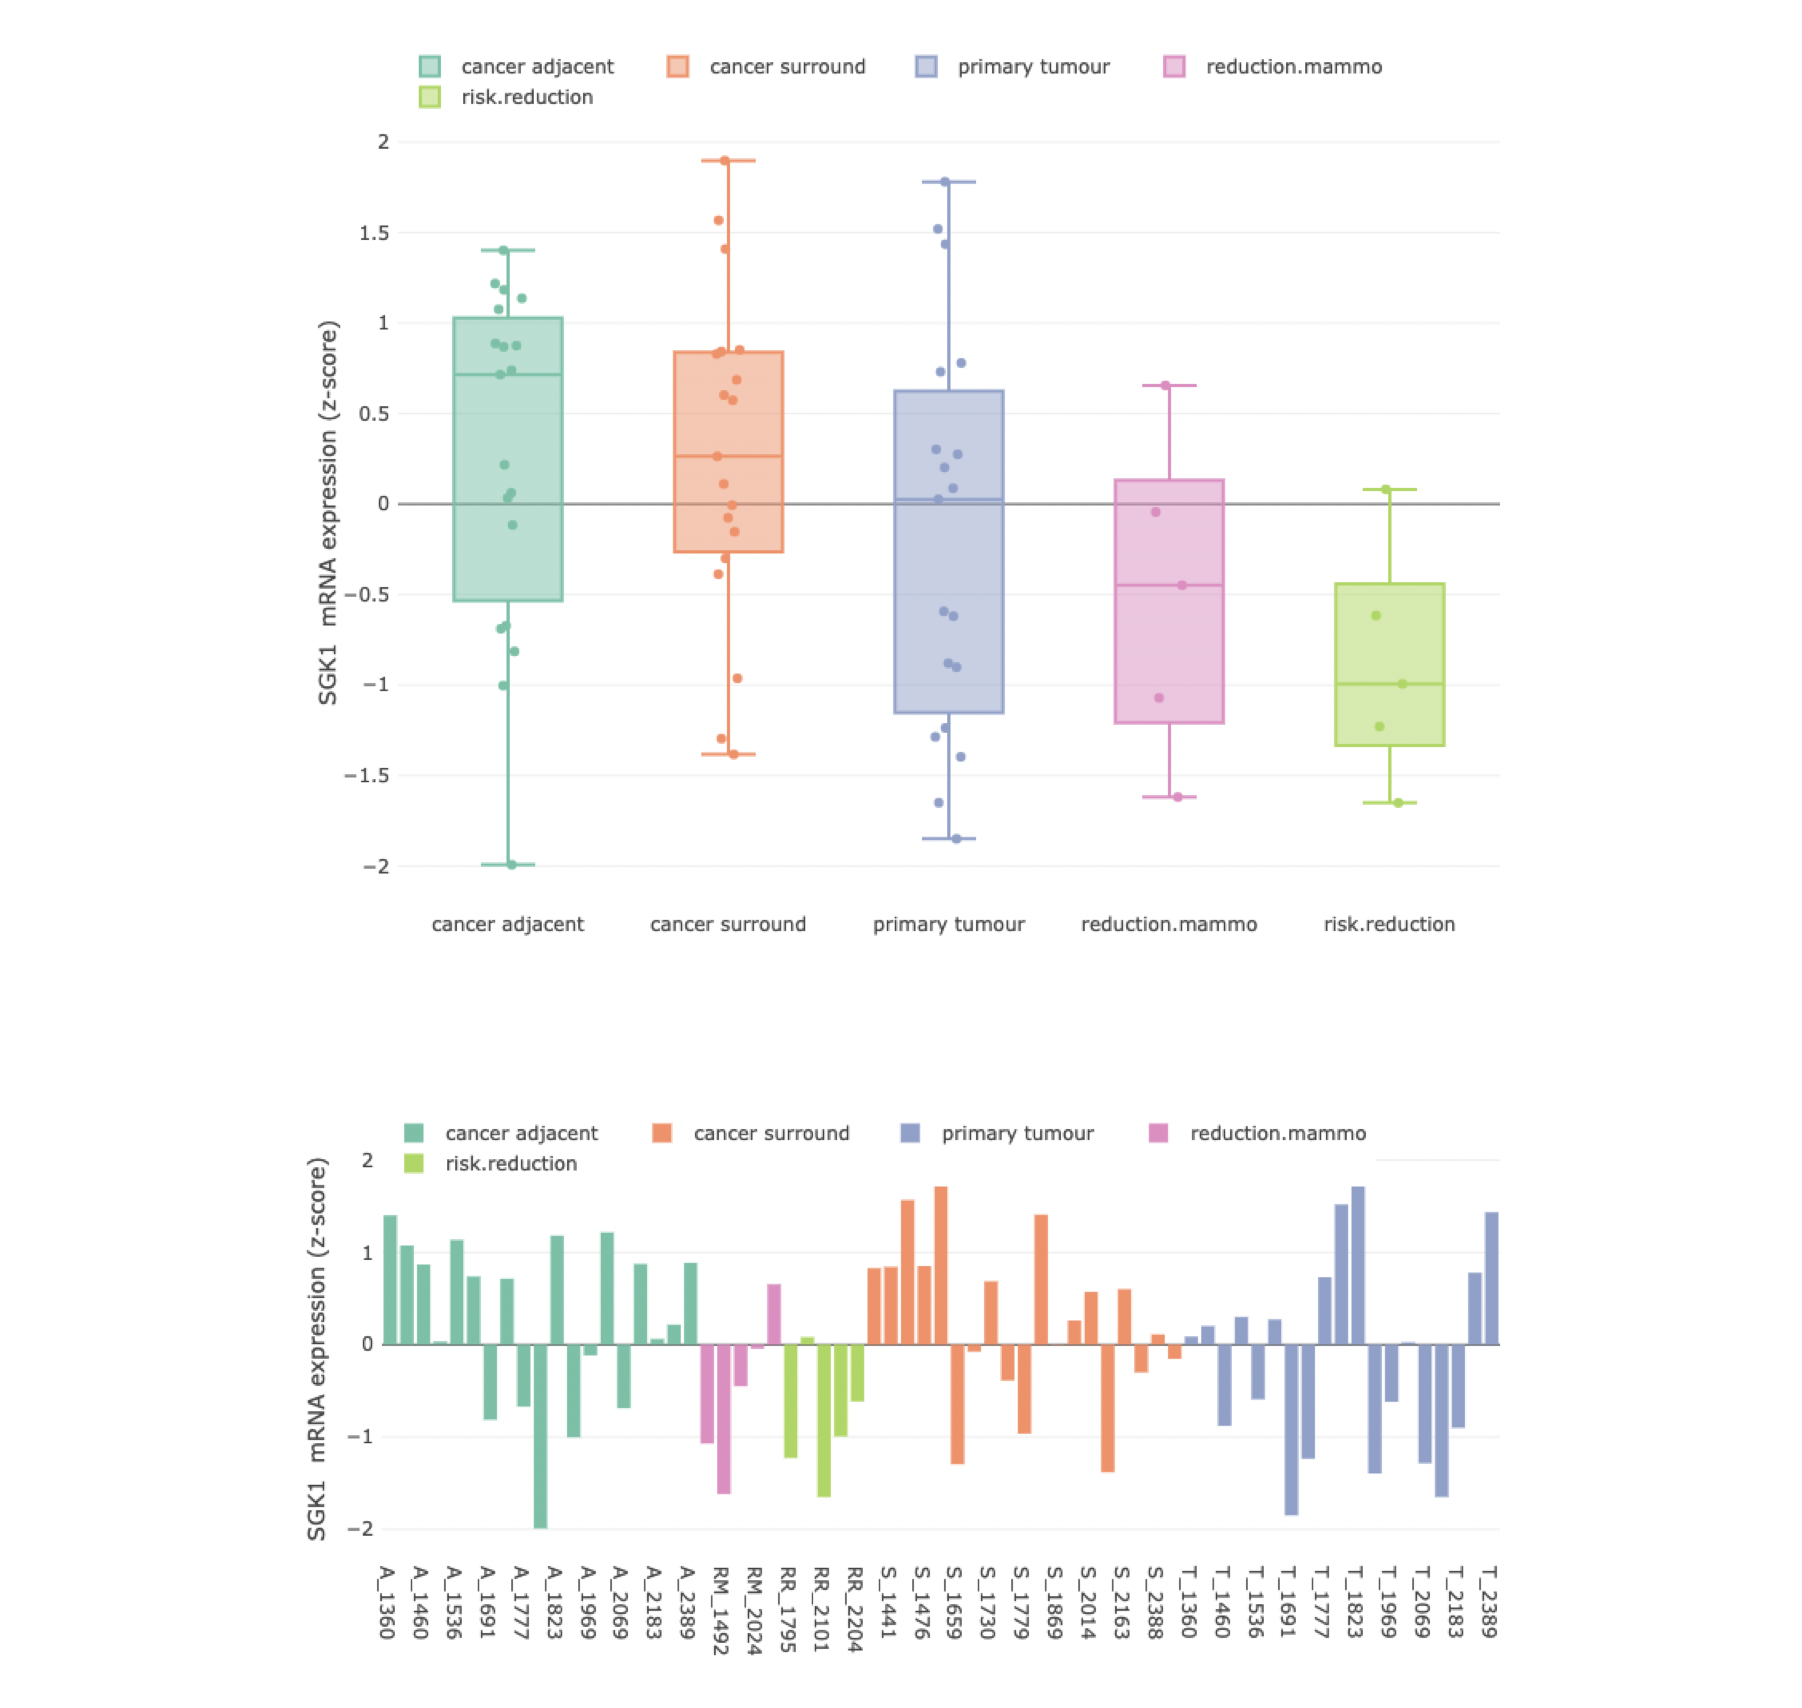
Expression Profiles. The distribution of mRNA expression measurements can be visualised across all samples for a user-defined gene (from the top 250 aberrantly expressed genes).

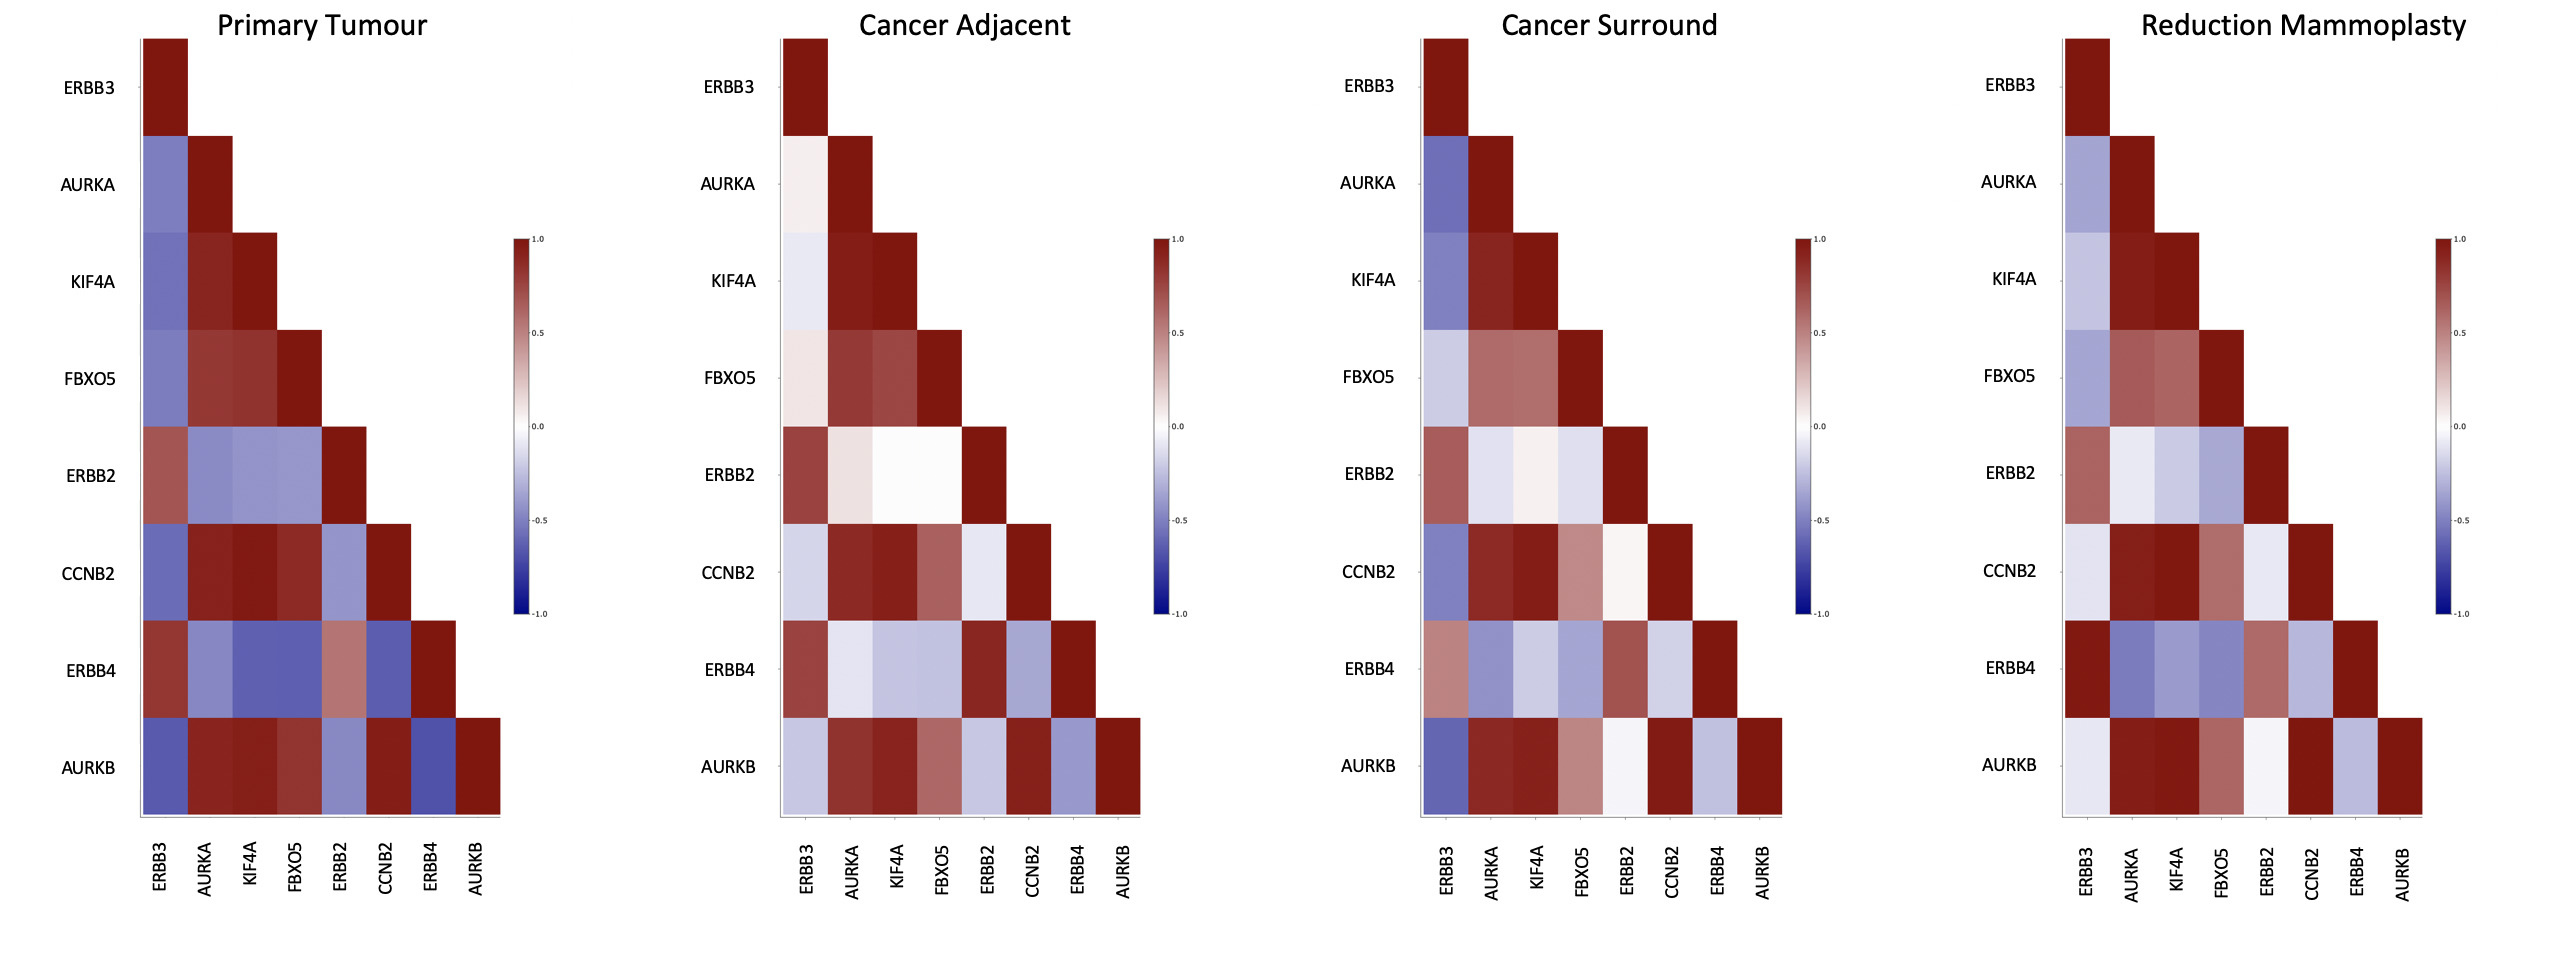
Correlation. Pairwise comparisons of expression profiles can be performed between multiple user-defined genes in each selected dataset and Pearson's correlation coefficients and p-values calculated for each comparison.

For queried set of genes (minimum of 3 genes), the Analytics Hub computes Pearson's correlation coefficients and corresponding p-values for all pairwise combinations of genes and displays the correlation coefficients in a form of pairwise comparison heatmap. The colour of each cell indicates correlation coefficient between corresponding genes labelled on the x-axis and y-axis. The heatmap colour key is displayed on the right-side of the plot with red and blue indicating high and low correlation values, respectively.


Search and Apply for BCNTB Samples

Links between the Analytics Hub and Sample Finder allow researchers to query the Analytics Hub and then request specimens with similar clinical/molecular characteristics from the Tissue Bank.For each query in the Analytics Hub, a link to the BCNTB Sample Finder is provided, with results presented for pre-selected clinical/molecular features of interest.


If you have any additional queries, please do not hesitate to contact us or complete an Expression of Interest form.