Genomics data from publicly available sequencing cohorts can be analysed using the integrated Bioconductor package MAFtools,
which facilitates the analysis of somatic variants containing single-nucleotide variants (SNV) and small insertion/deletions (indels),
based on variant characteristics, gene interactions and protein changes.
VARIANT IDENTIFICATION
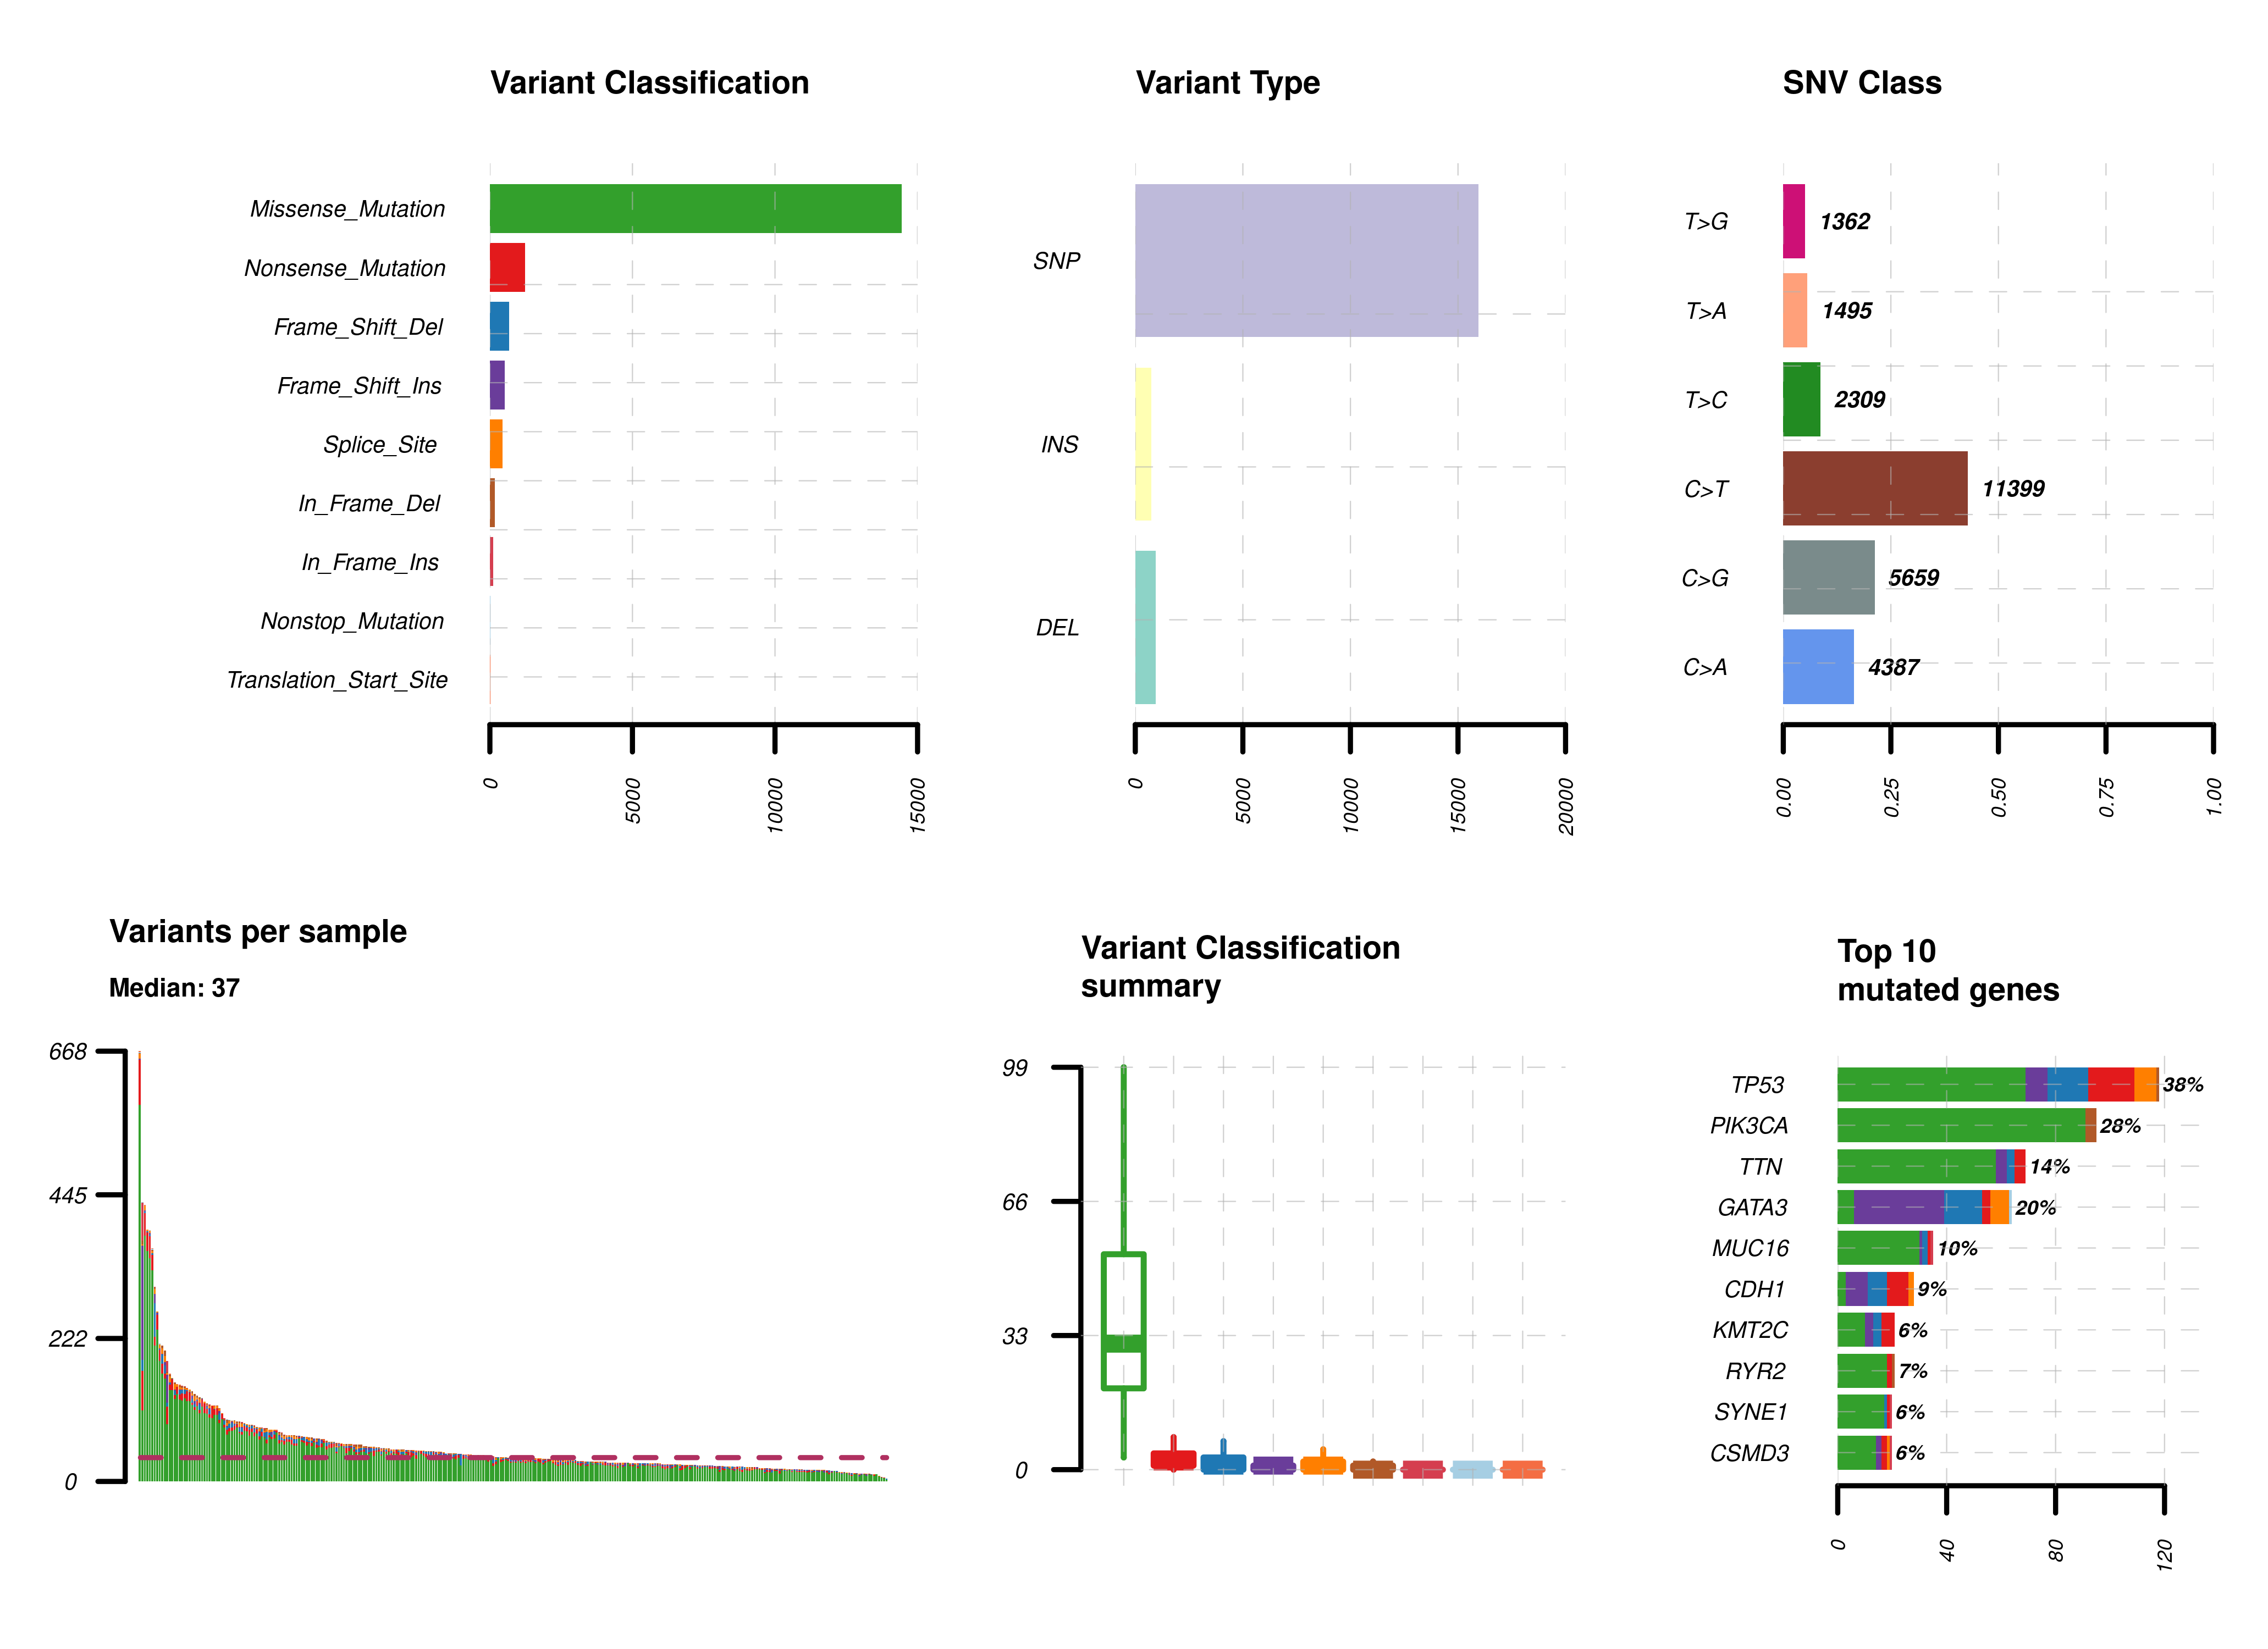
Summary. A MAFtools summary plot is generated for each cohort, displaying the range of variant classifications,
variant types and base substitution profiles as bar plots and/or box plots. The number of variants in each sample can also be
viewed as a stacked bar plot, alongside a summary of the top 10 mutated genes for each cohort.
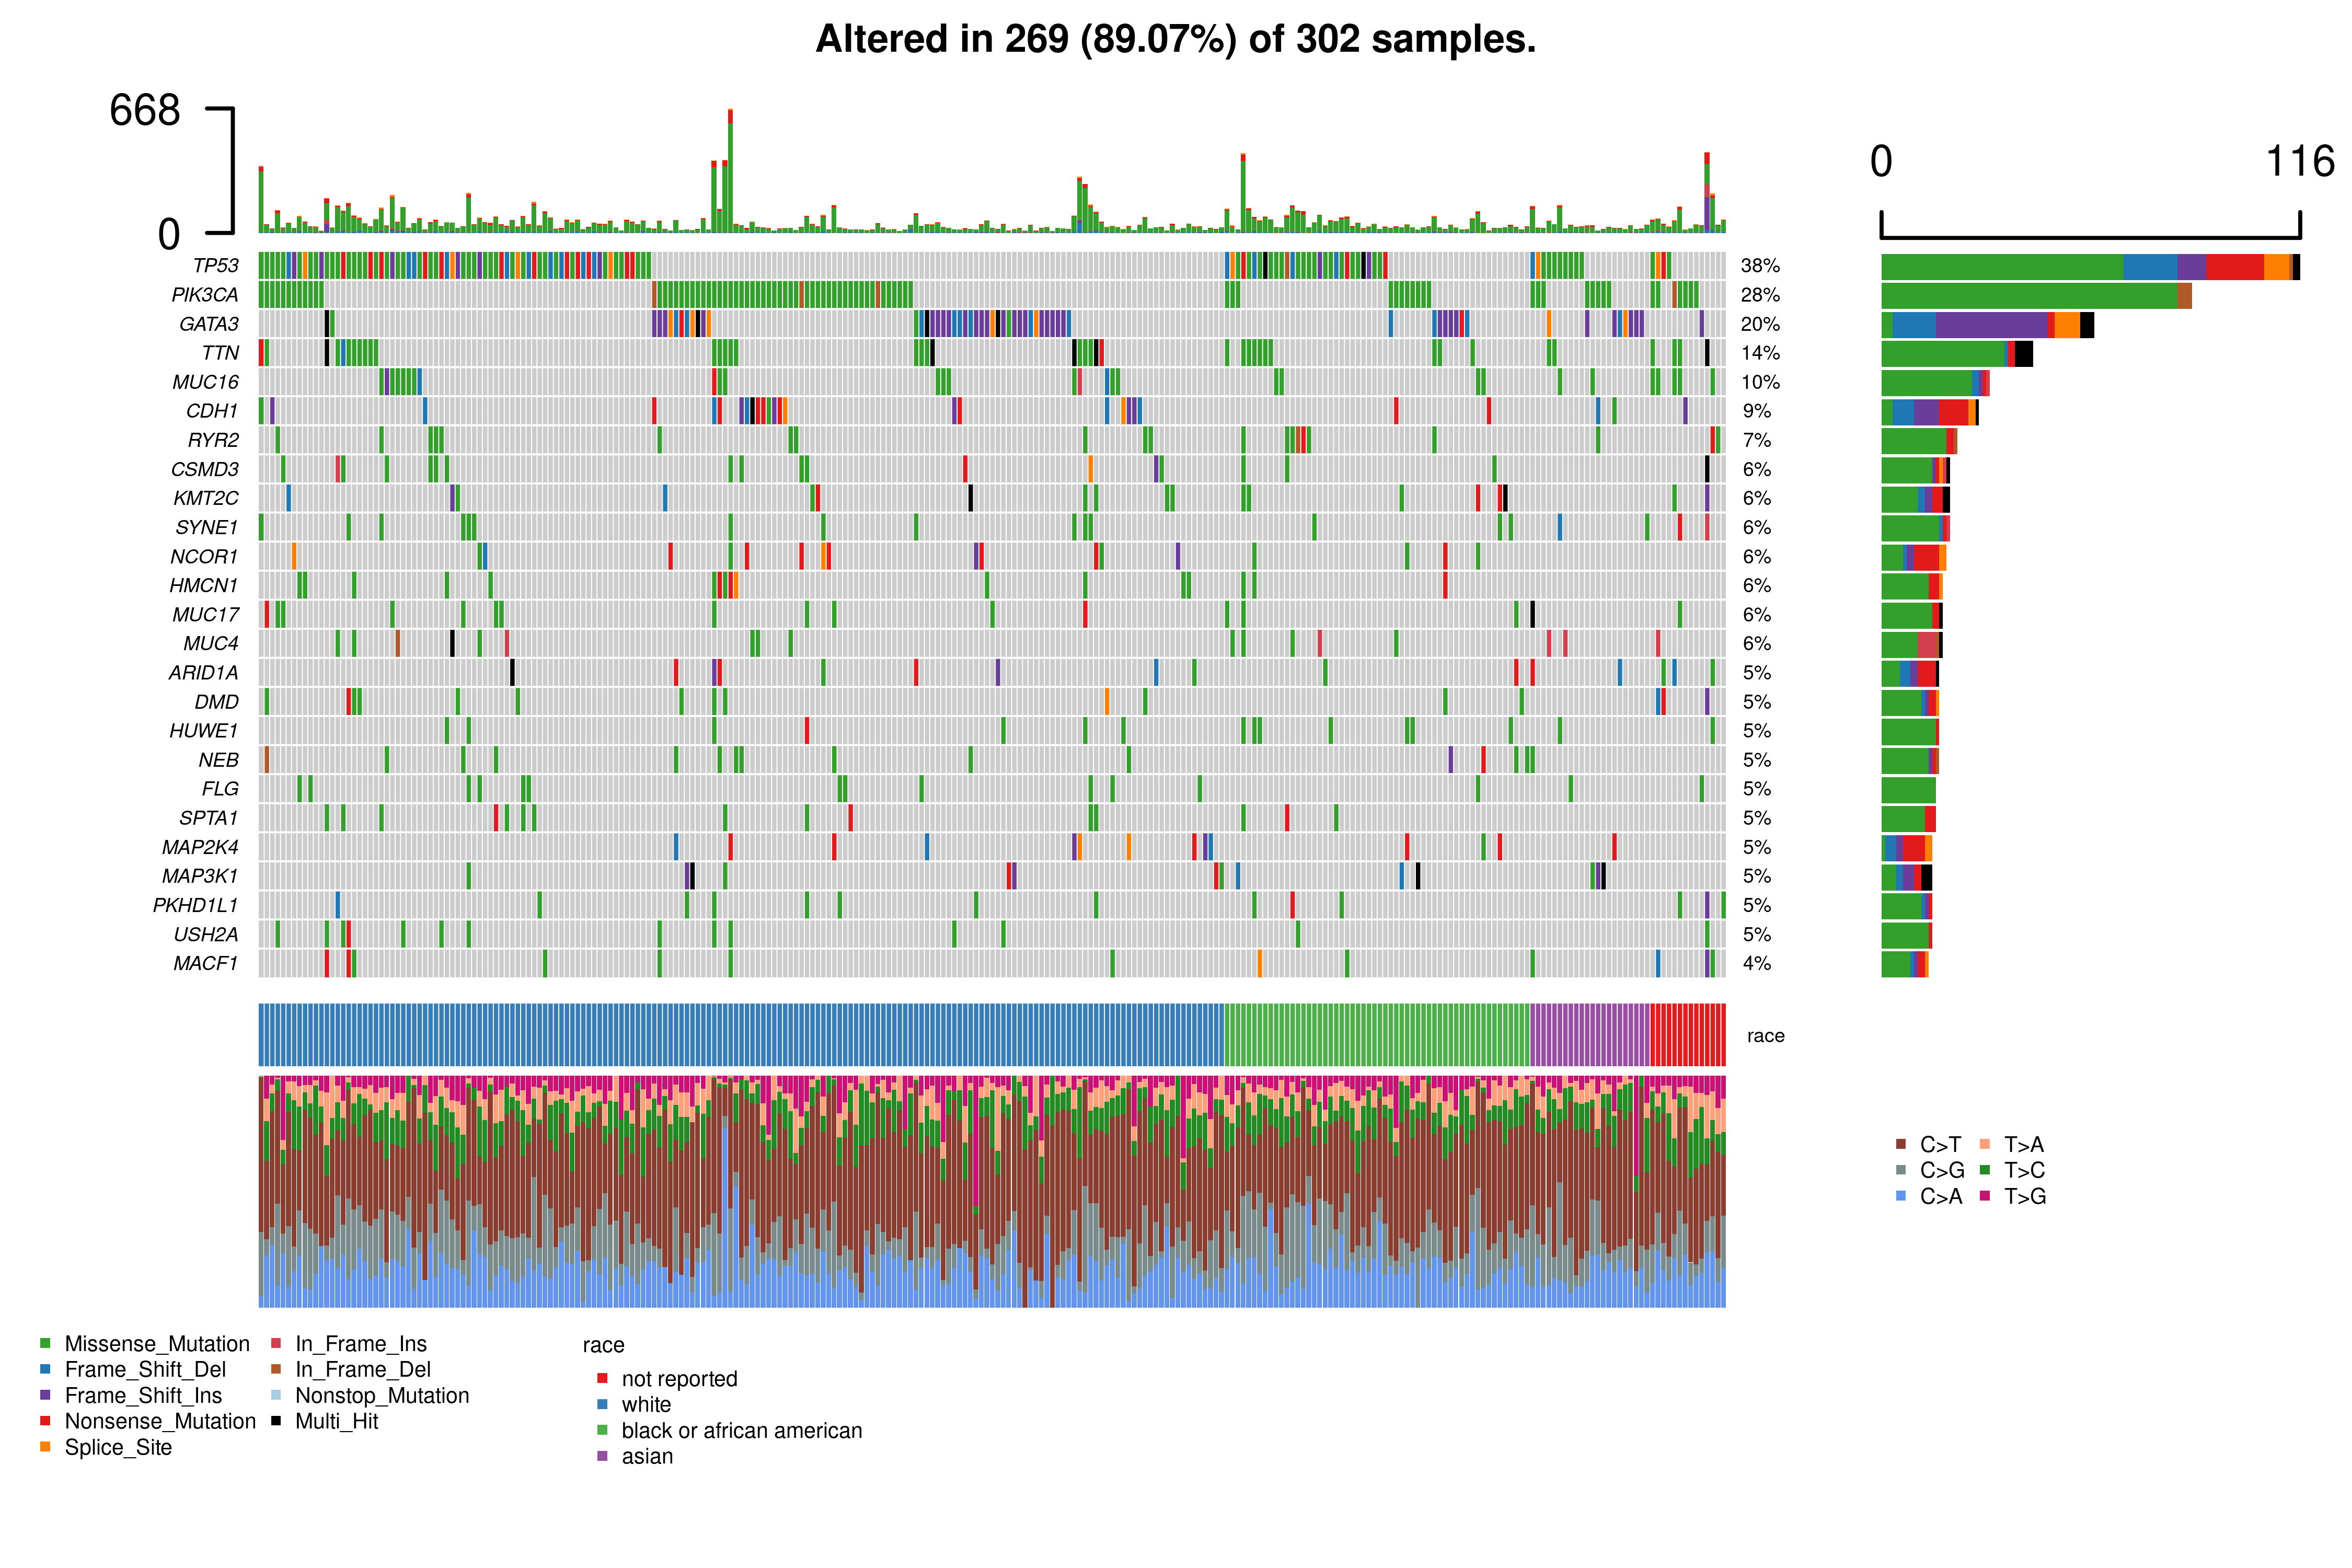
Oncoplot. The oncoplot allows users to explore the mutational landscape of the top mutated genes in the cohort defined.
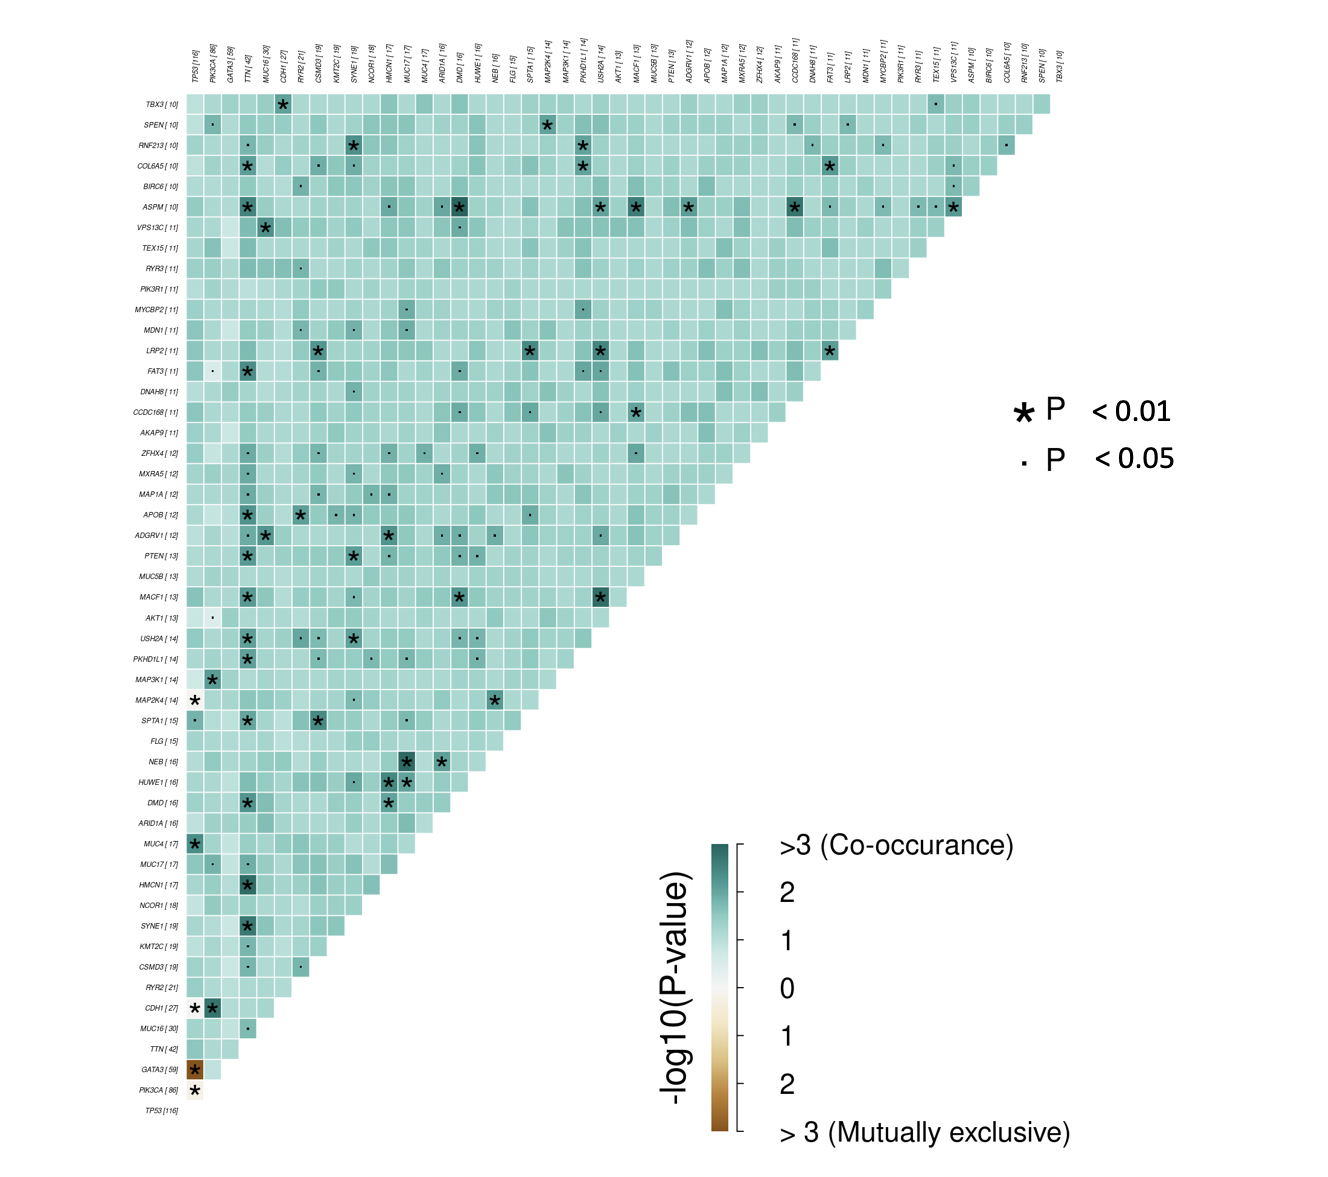
Somatic Interactions. Pair-wise Fisher’s Exact test is performed on the top 25 genes to detect mutually exclusive or co-occuring genes and presented as a correlation matrix
(where * is p<0.01 and . is p<0.05).
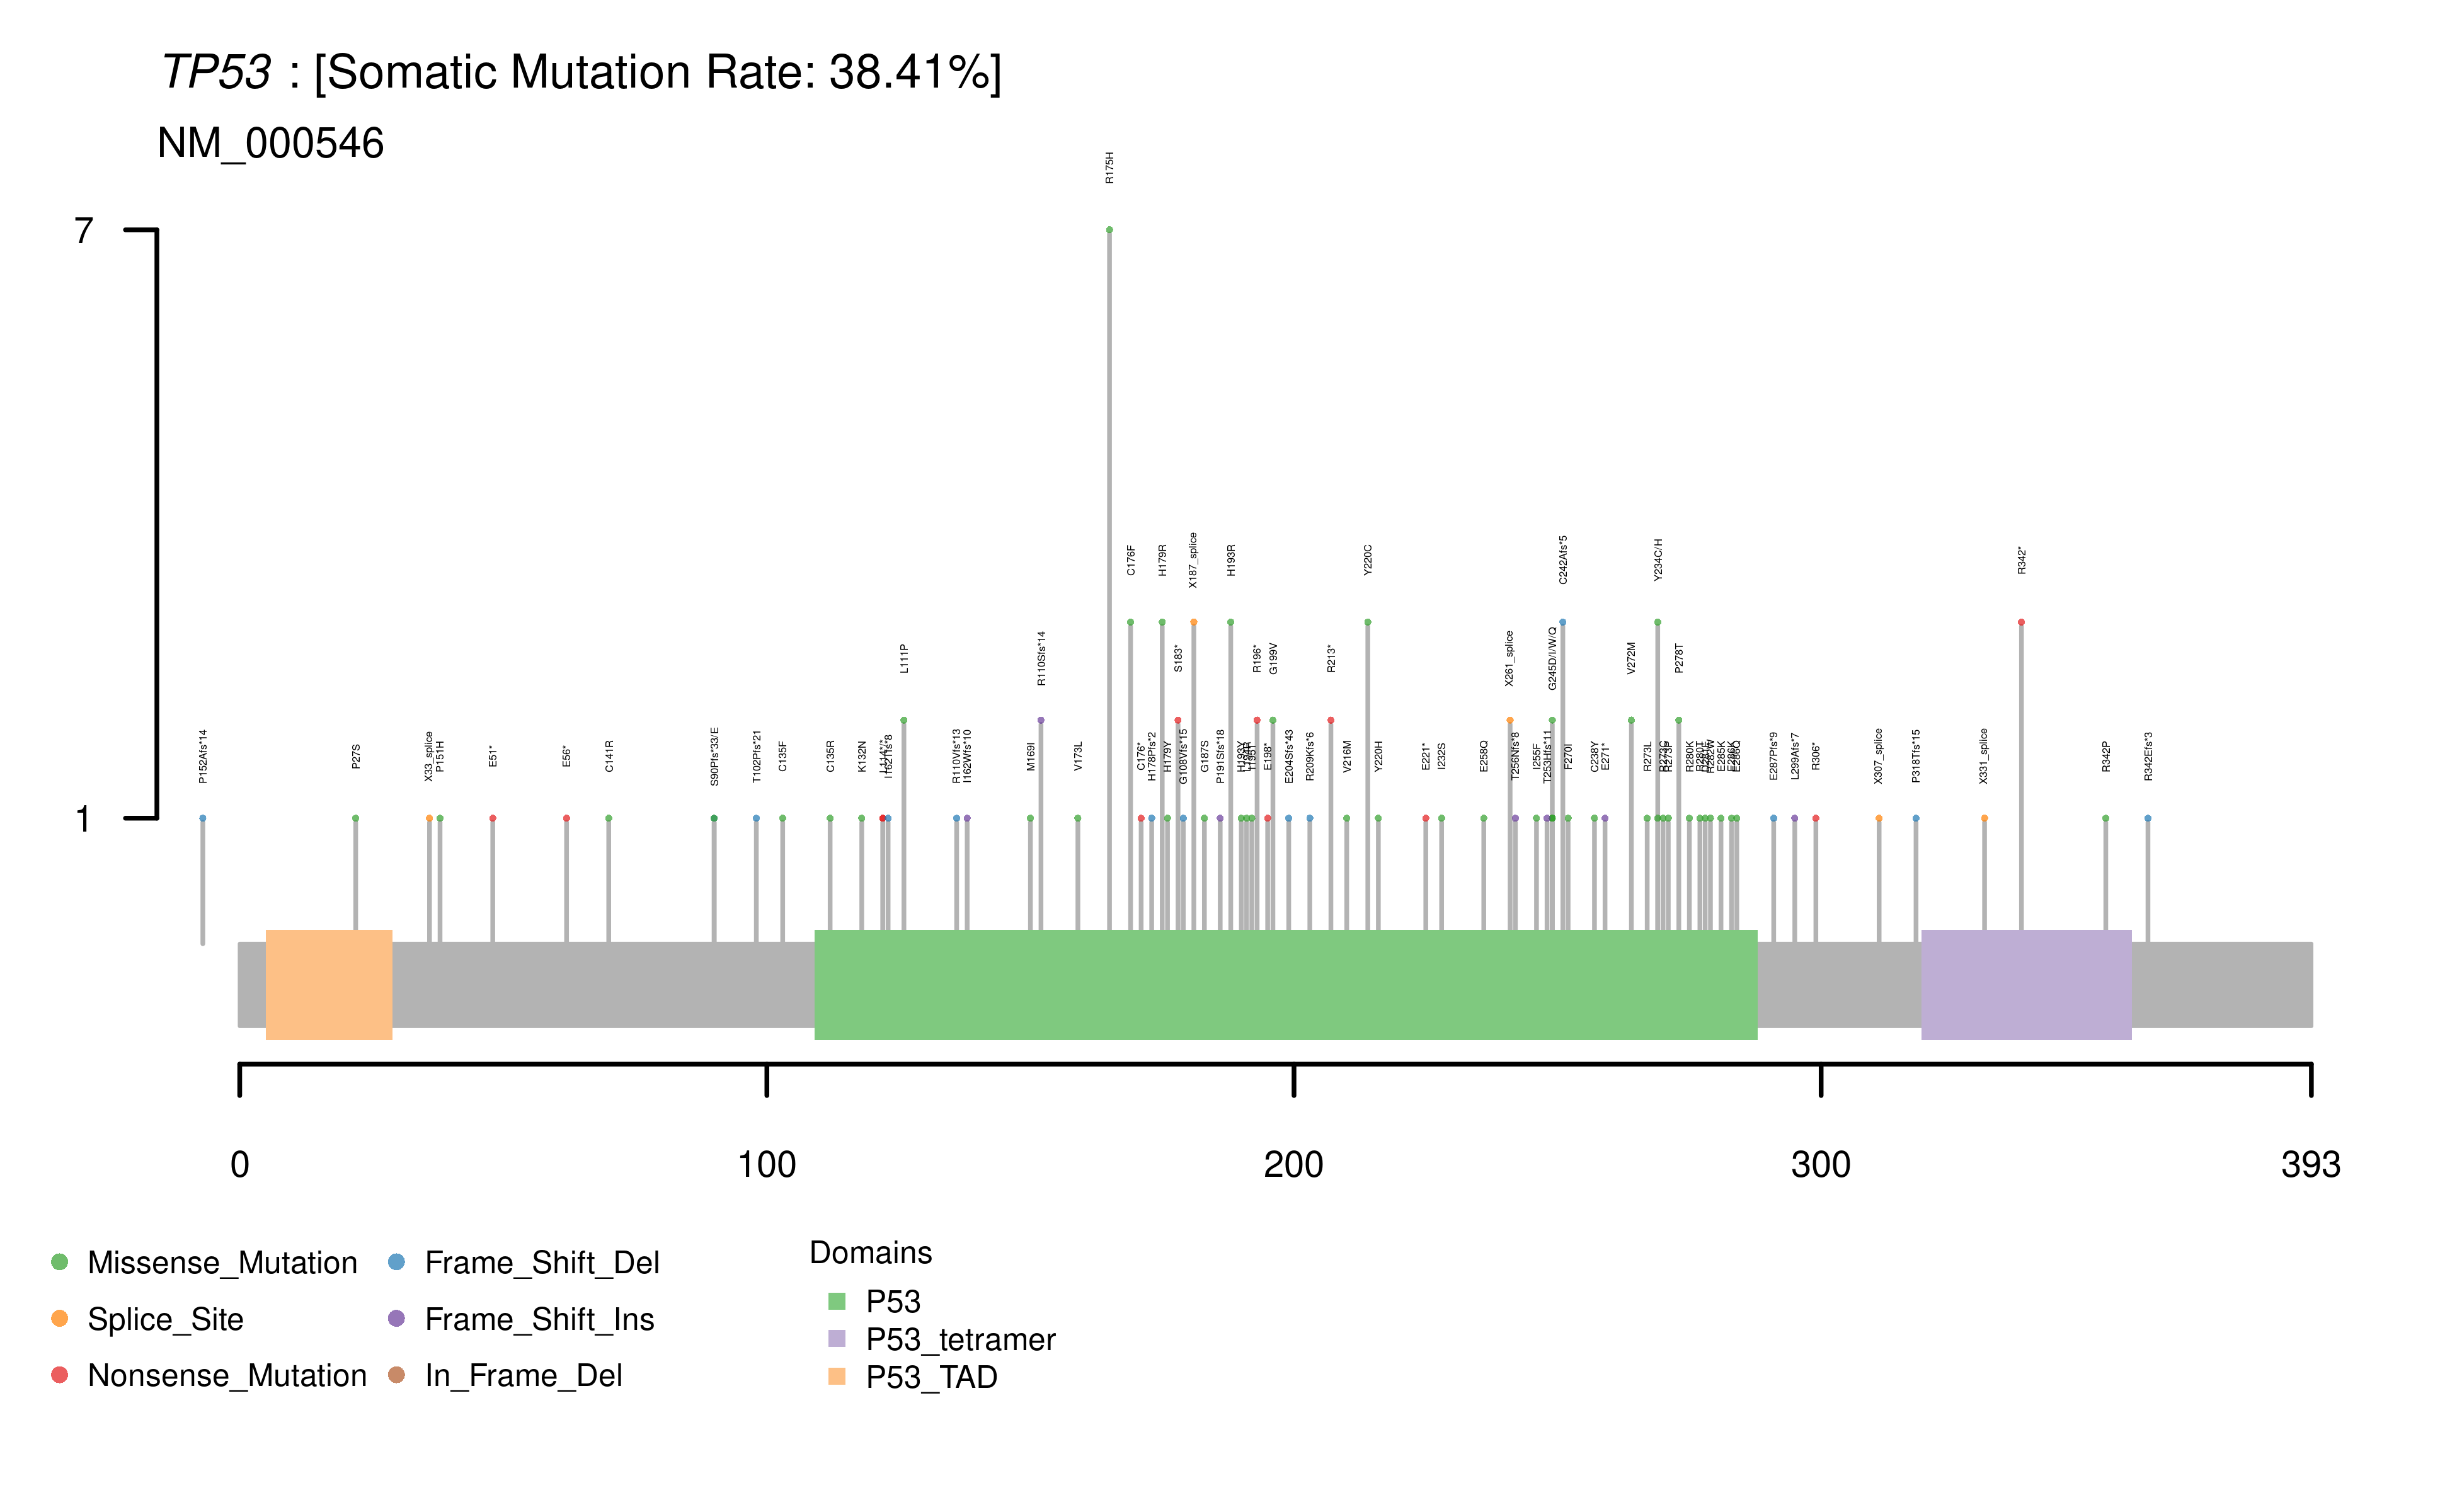
Lolliplot. Users can also select to view amino acid changes within each of the top 50 mutated genes in each cohort as a lollipop plot. These plots display
the observed mutation distribution and protein domains, which are labelled for each selected gene. A summary of the observed somatic mutation rate for each
selected gene is also provided alongside each plot.
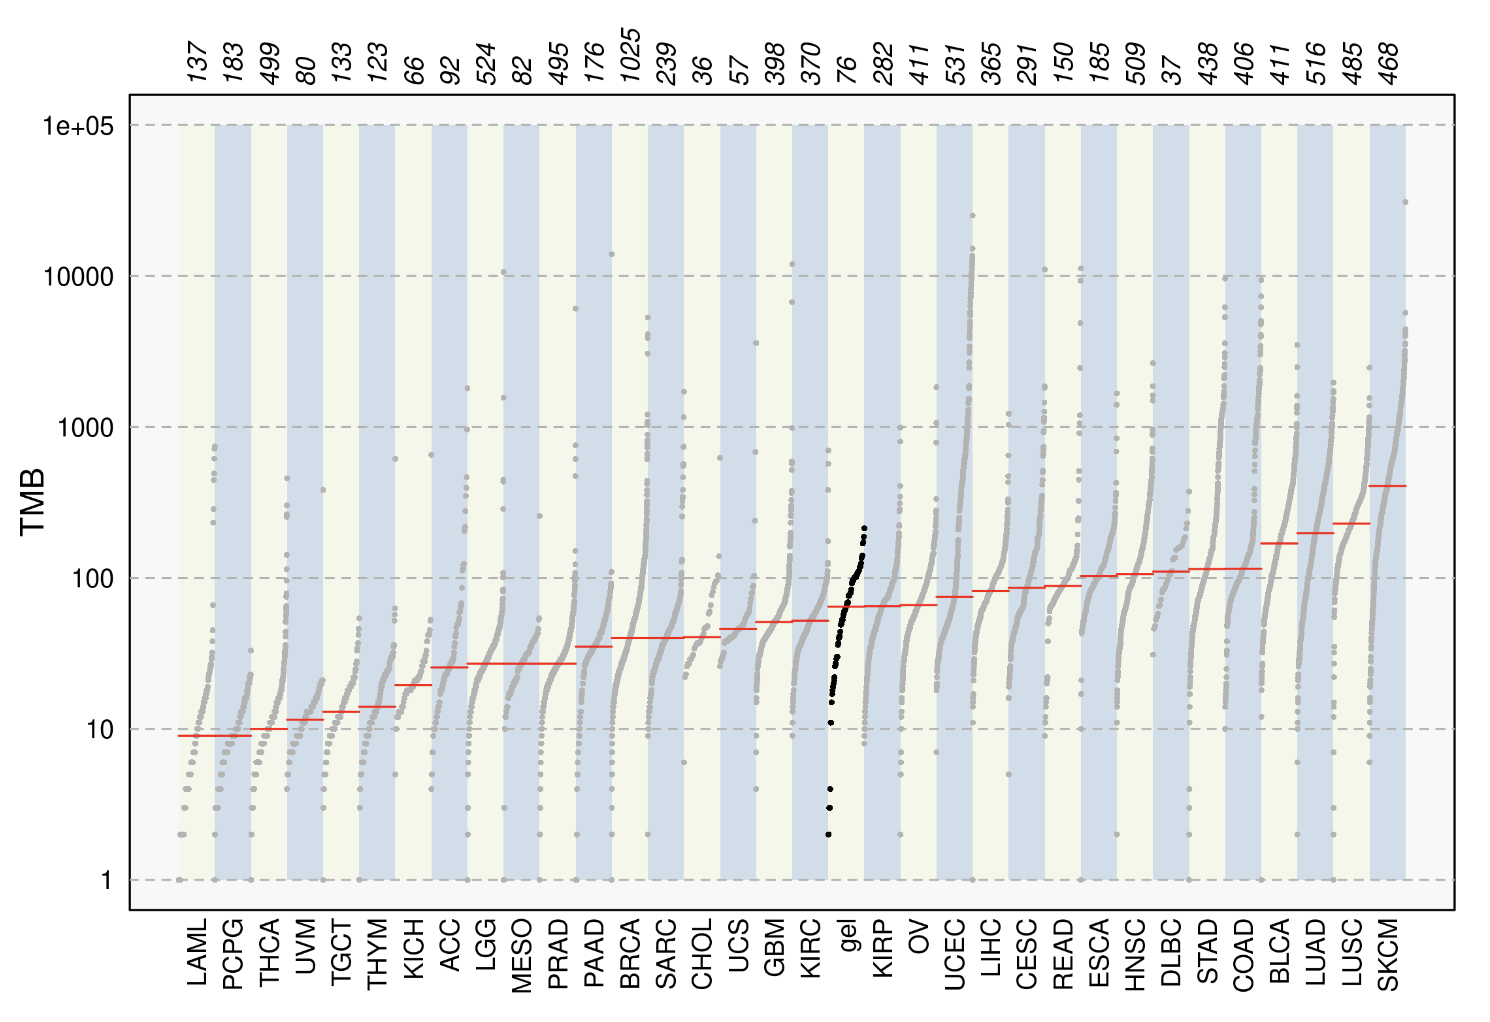
TCGA Compare. Researchers can compare the tumour mutational burden of their selected cohort to that of 33 independent TCGA cohorts
derived from the MC3 Project.
DRUG PREDICTIONS
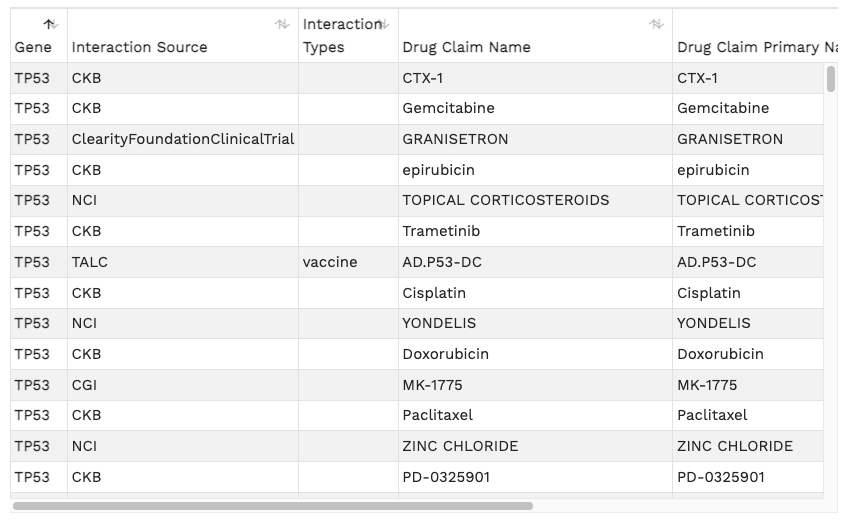
Drug-Gene interactions. The barplots present known/reported drug interactions or druggable categories compiled from the Drug Interaction Database.
These results are also presented in a searchable tabular format.
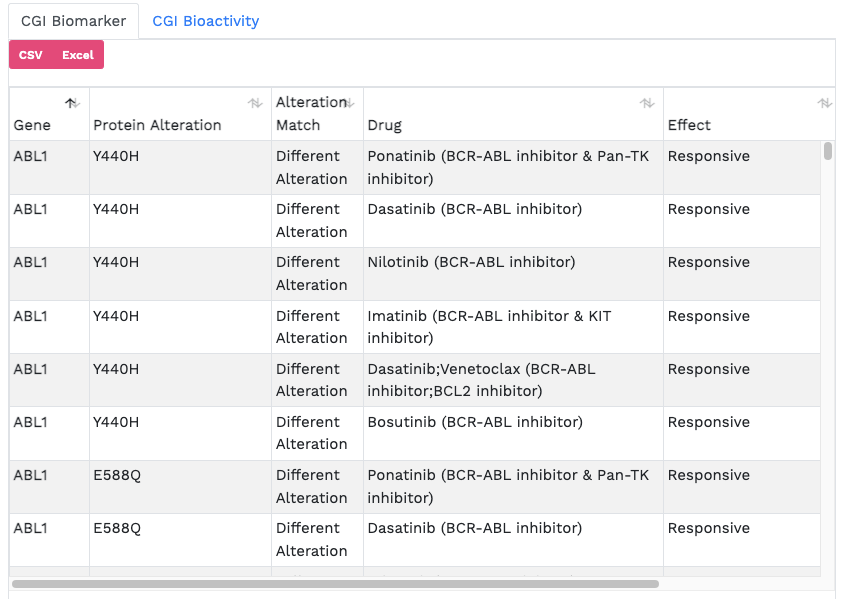
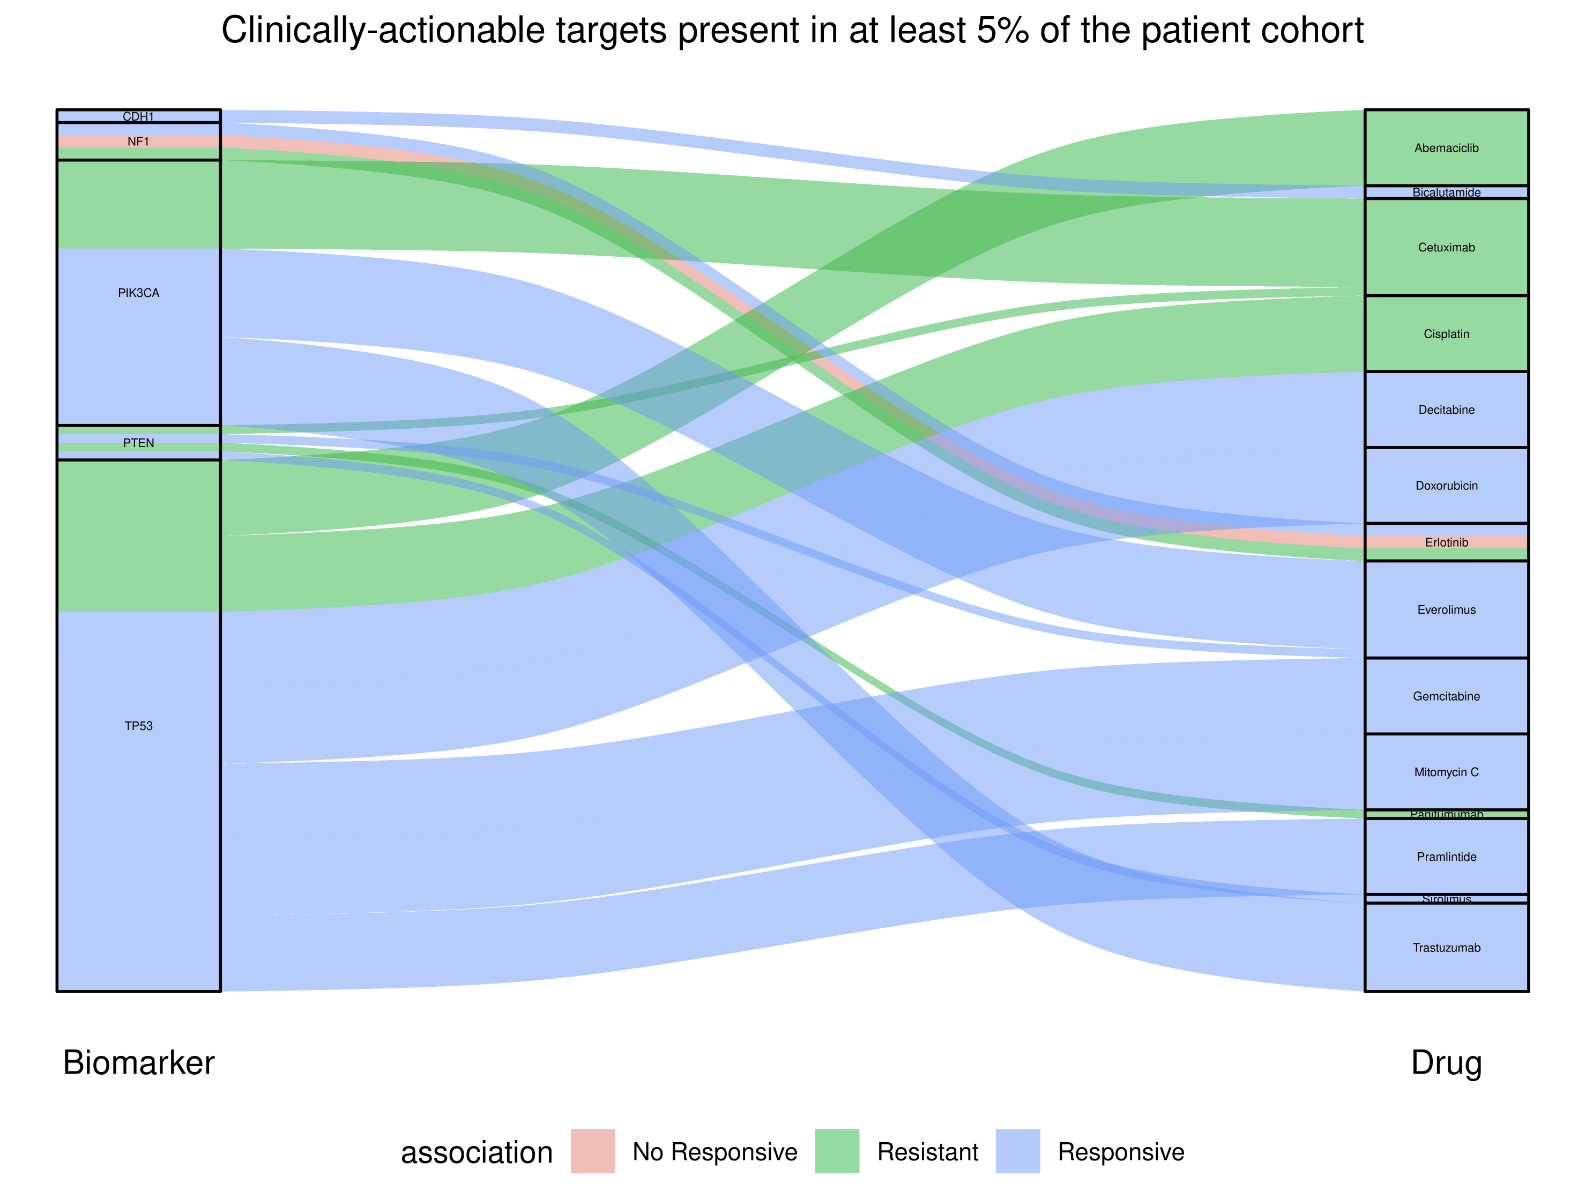
Cancer Genome Interpreter (CGI). The CGI is a third-party tool developed to help in the interpretation of sequenced cancer genomes, assessing the potential of somatic
alterations to act as tumour drivers and the possible effect on treatment response. The Analytics Hub presents potential cancer driver mutations from the user-selected cohort
in tabular format and highlights those that may be therapeutically actionable in an alluvial plot.
INTERACTIONS AND PATHWAYS
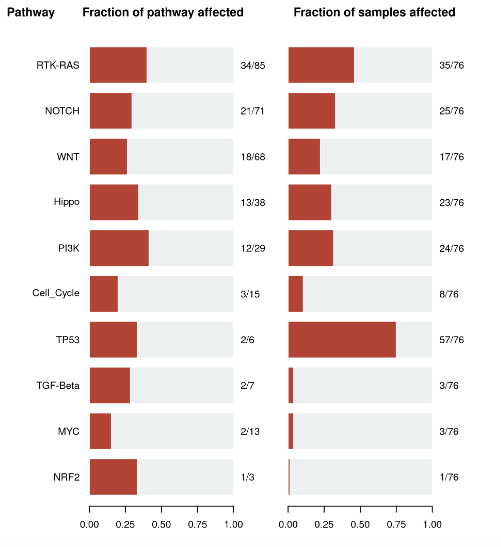
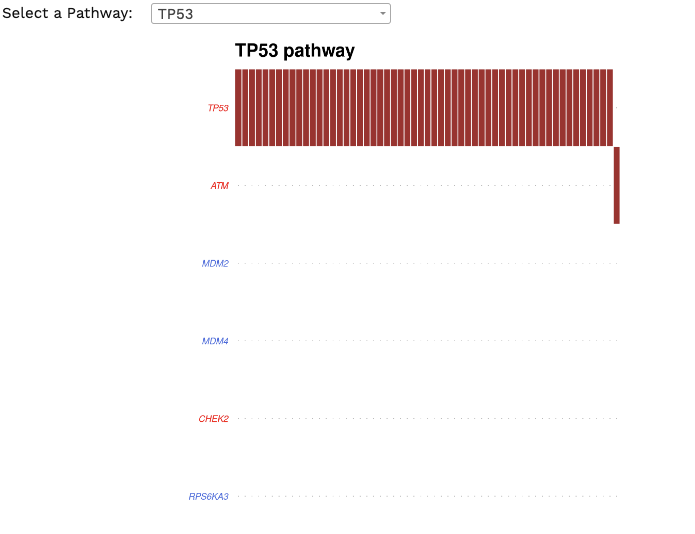
Oncogenic Pathways. Displays an summary of enriched oncogenic signalling pathways (as developed from TCGA projects)
present in the cohort. Researchers can focus on a pathway of interest, with each red box representing a patient and gene names coloured by potential function
(tumour supressor genes in red and oncogenes in blue)
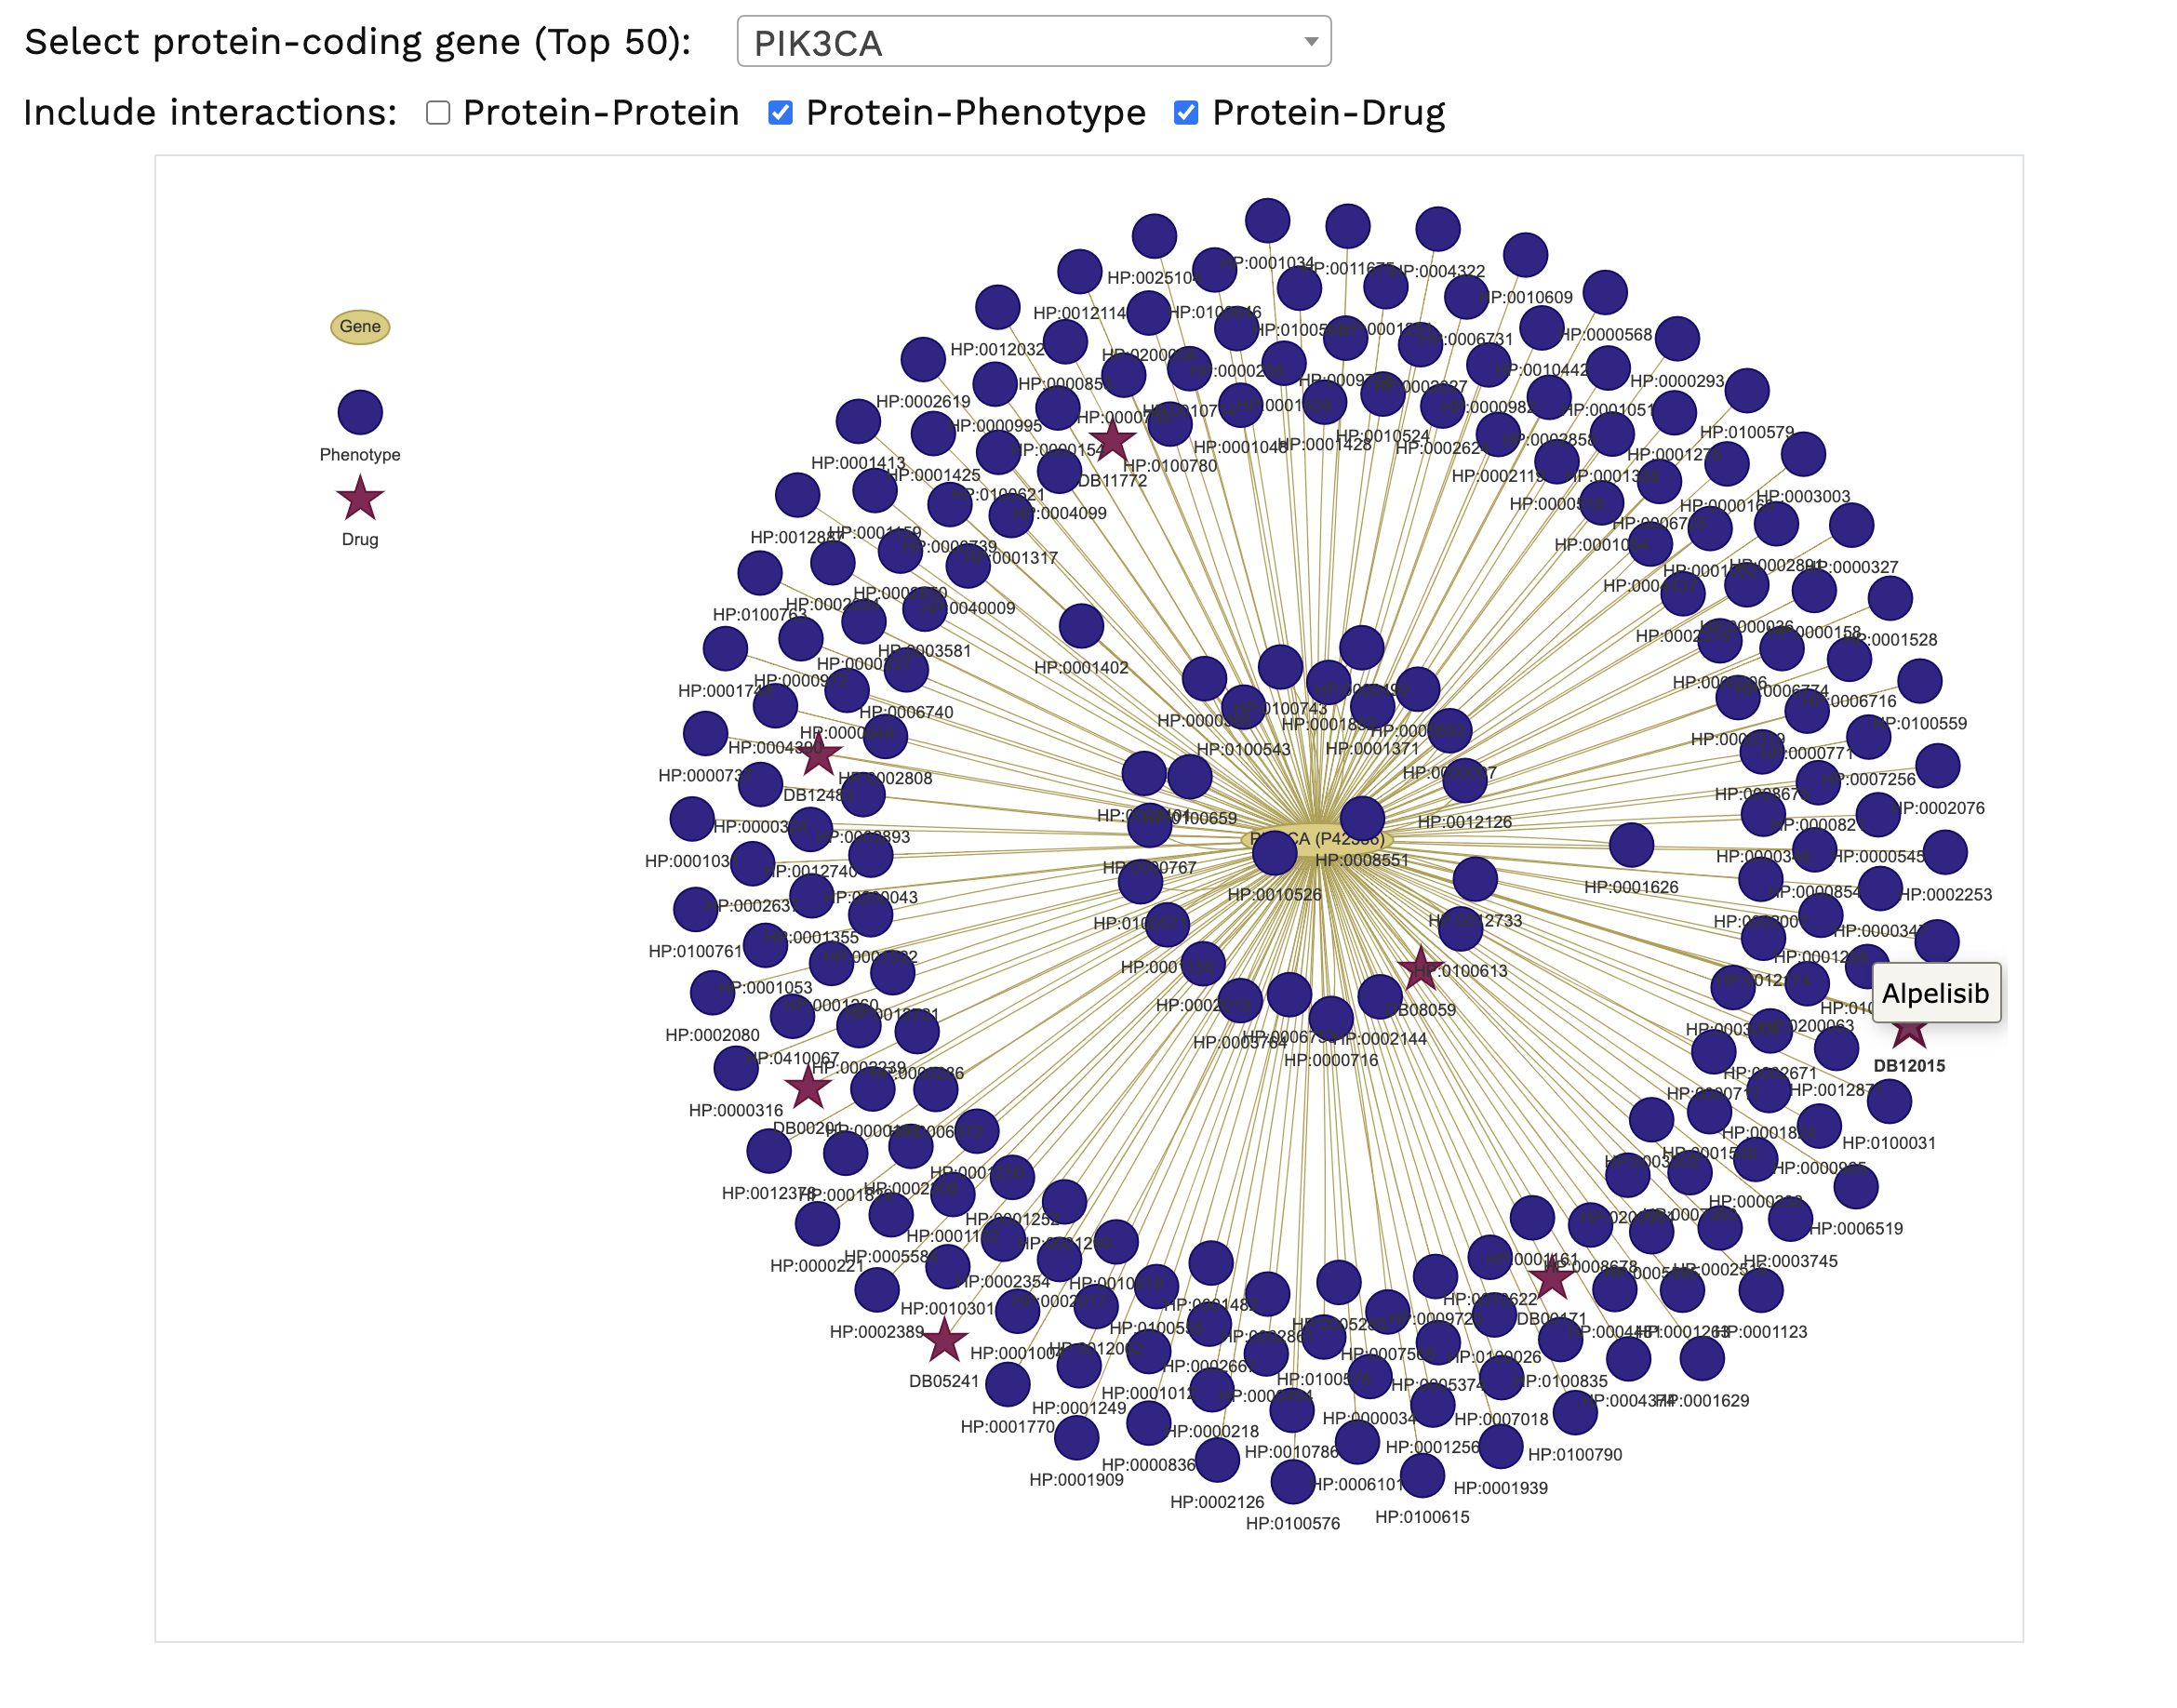
Protein-Protein and Drug-Target Interactions. The characterisation of drug-target interaction networks can provide an important tool
to identify potential targets amenable to treatment with existing drugs. The networks available are based on the protein-protein and protein-drug interactions.
Variants within candidate genes of interest can be queried against the DrugBank database, for the analysis of potential genotype-driven therapeutic targets.
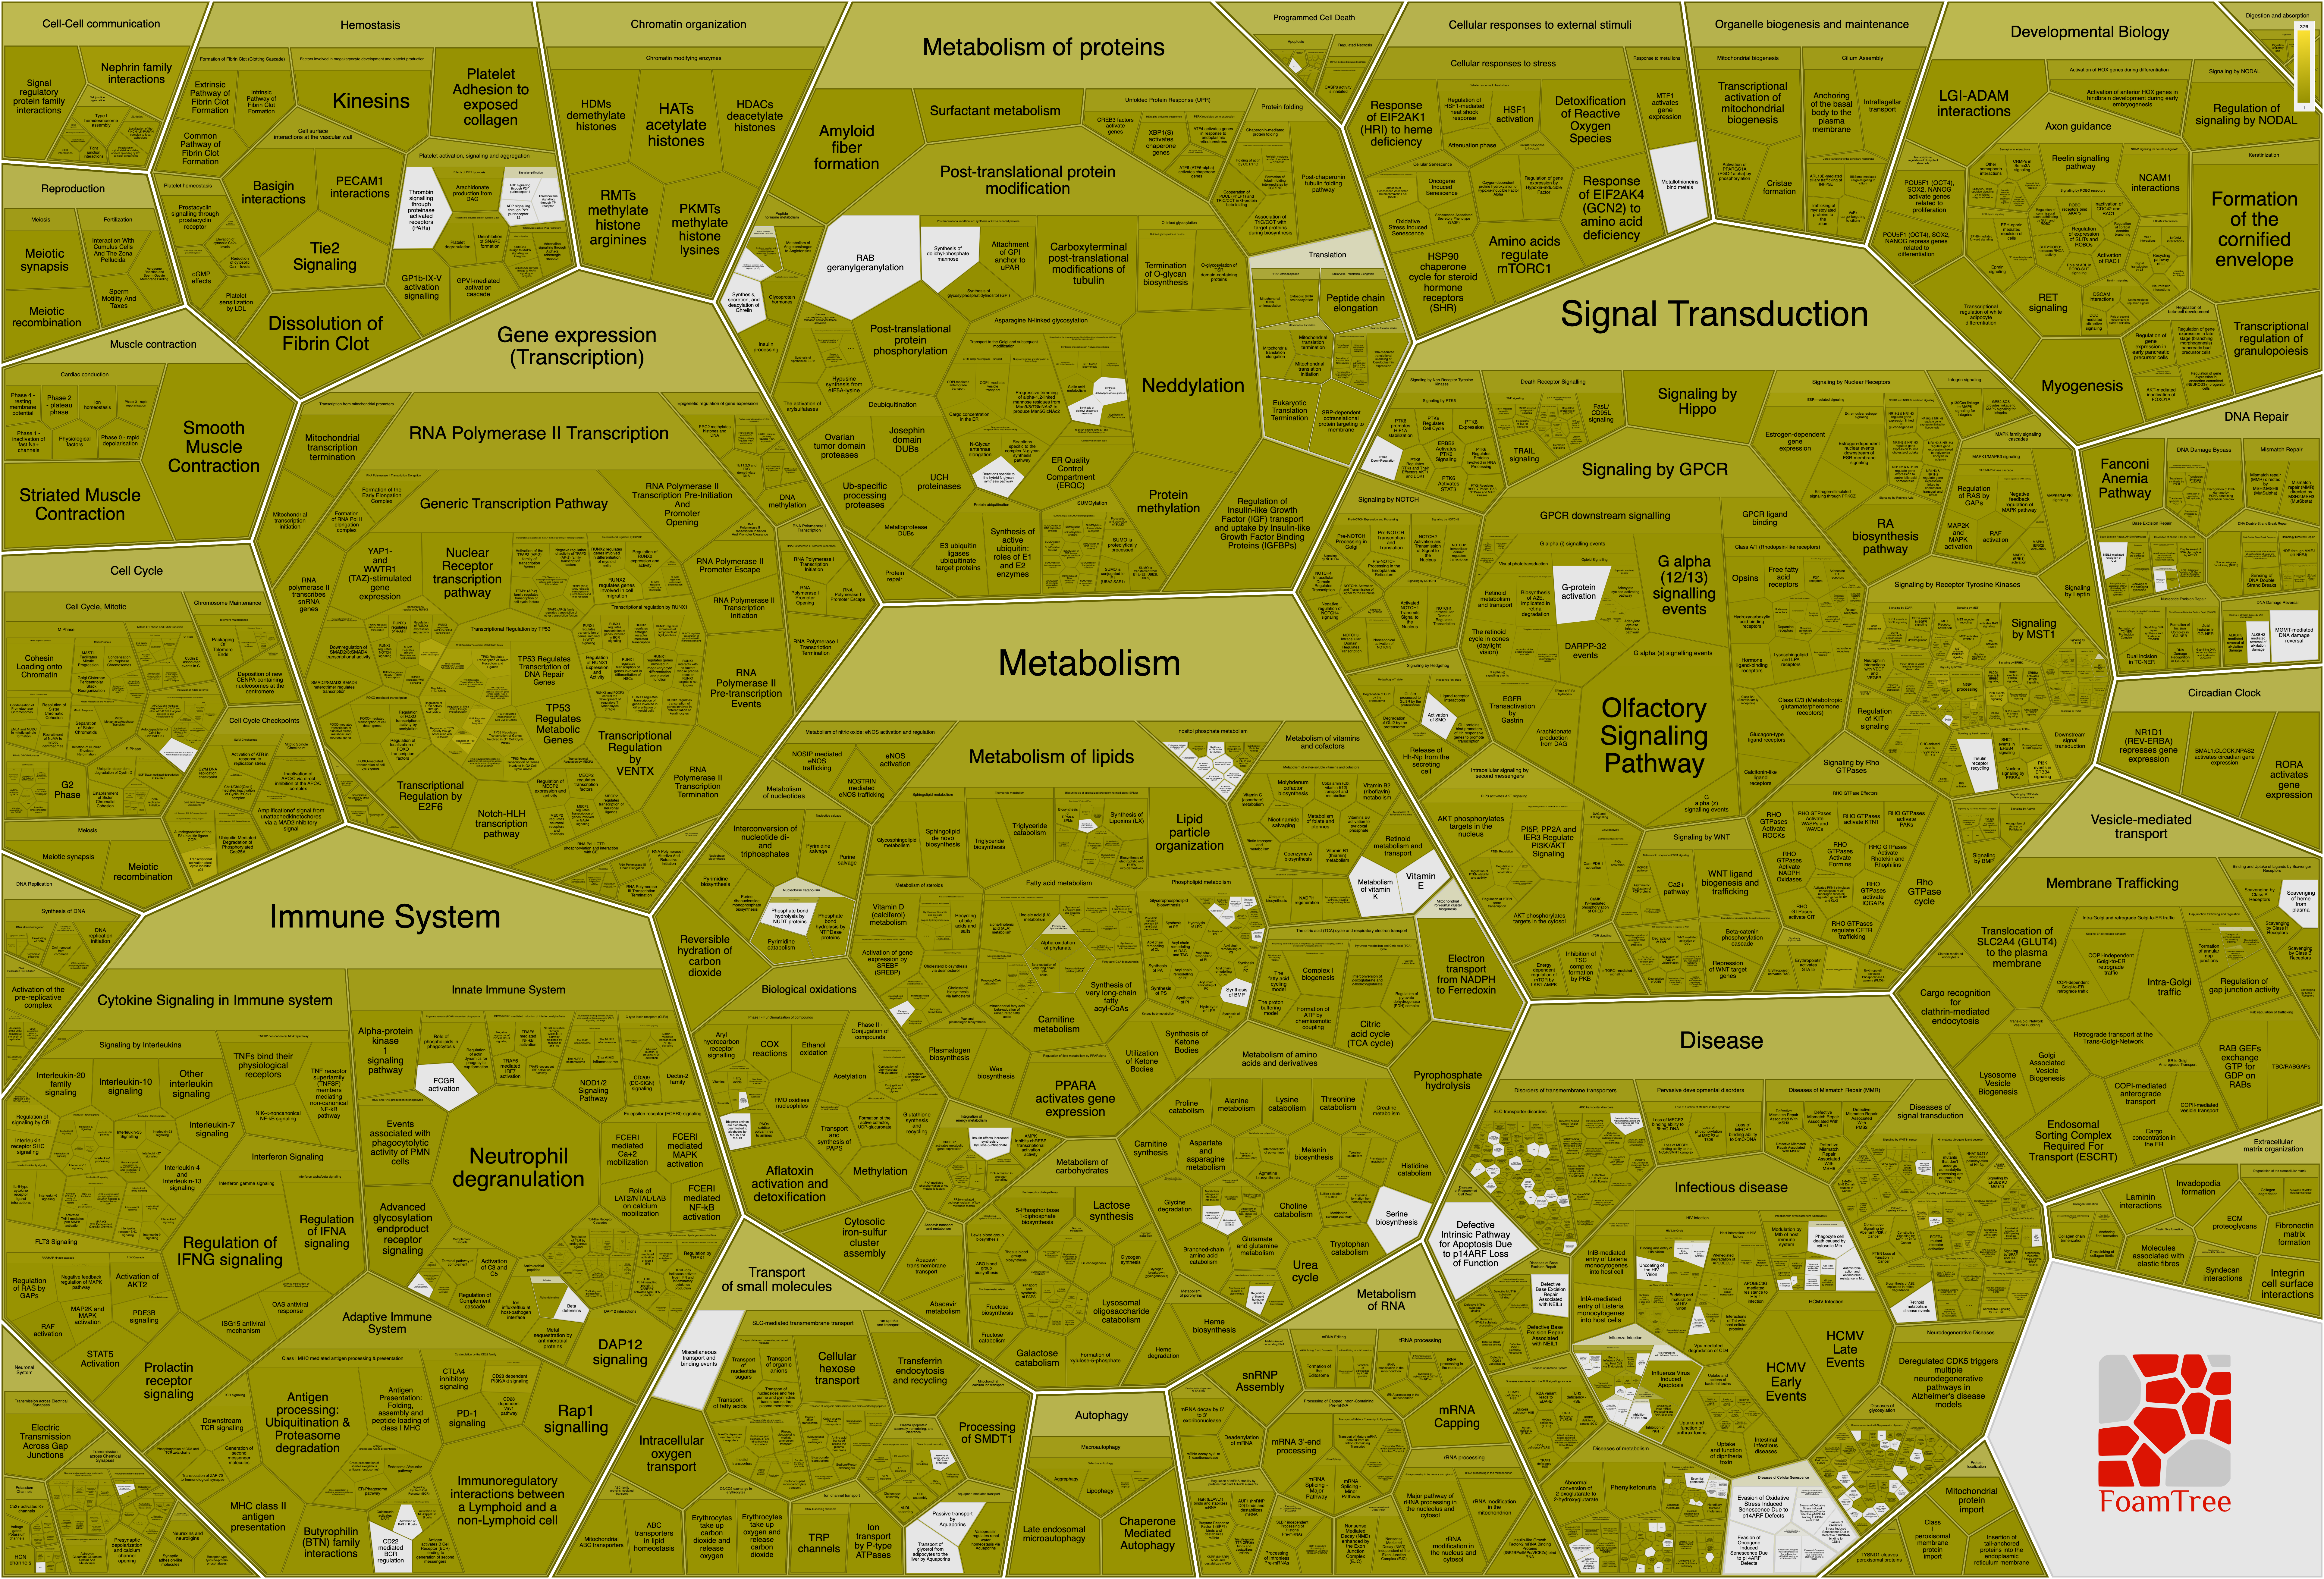
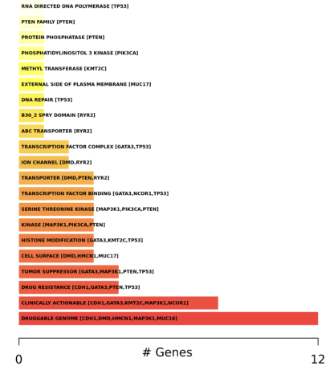
Reactome Pathways. For each query set, variants identified are mapped to their genes. These genes are then linked to their associated biological
pathway(s), with results provided in both tabular format and as a link to an interactive Voronoi diagram.
The intensity of the yellow color scale represents the number of patients in the selected cohort for which the pathway is affected.